Six months of data since the Busan Accord shows China shipped the world more rare earth magnets than in any of the previous four years. A year earlier, China had threatened to restrict rare earth supply altogether. This briefing examines how those supplies were shared unevenly across China's major trading partners.
Authors
Simon Evenett
Date Published
31 May 2026
Related Topics:
Executive Summary
China’s announcement last year that it would institute a new restrictive export regime for rare earth metals and magnets sent shockwaves through the boardrooms and C-suites of advanced manufacturing companies and through the corridors of power around the world. Ultimately, China stepped back from the brink and, as part of the Busan Accord agreed with the United States in October 2025, agreed to suspend its implementation of this new regime.
Now that six months’ export data is available since the Busan Accord was signed, it is possible to check whether Chinese exports of rare earths changed markedly. A commitment to the status quo ante export control regime need not result in prior export levels being observed. Moreover, only trade data can reveal whether governments, in particular those in diplomatic disputes with Beijing, were treated similarly to others in terms of rare earth shipments.
Here is the paradox at the heart of the data. Since Busan, China shipped the world more rare earth magnets than in any of the previous four years, yet sent its treaty partner, the United States, fewer than in any of them.
China kept its word to world markets. Measured in volume against the same six months in each of the four preceding years, no rare earth metal saw shipment levels below pre-Busan norms. Meanwhile, China shipped a quarter more rare earth magnets than the norm, some 33.2 million kilogrammes against a range that had topped out at 28.3 million. Several metals witnessed export surges. Dysprosium, the heavy rare earth prized for high-performance magnets, rose almost fivefold, while cerium nearly doubled and scandium nearly tripled. On this aggregate measure, the rare earths "bazooka" Beijing brandished in 2025 was not fired.
Yet greater rare earth supply was shared unevenly. The European Union, Japan, South Korea and ASEAN each received shipments of every product within or above its pre-Busan range, with the EU taking record volumes of four metals and its largest magnet shipments in four years. Indeed, for all the talk of Beijing punishing Tokyo over its prime minister's remarks on Taiwan, the available data gives no support to claims that China cut off Japanese buyers; Japan's magnet shipments ran fully 50 per cent above their four-year average, the strongest showing of any major export destination for Chinese rare earths.
The United States, the counterparty to the Busan Accord, was the sole exception. Shipments of mixed and alloyed rare earths ran 60 per cent below the benchmark. Washington received not a single kilogramme of yttrium since Busan. Even volumes of finished magnets received were 9 per cent below the pre-Busan norm. Reduced rare earth supply to the United States may amount to delayed punishment for starting a trade war with China in 2025.
The pattern of rare earth supply to China’s major trading partners since Busan has the whiff of divide and rule. Because China suspended rather than abolished its export regime for rare earths, with a renewal decision expected by November 2026, these volumes could shift again with little warning, and that discretion is itself the point: generous supply today is a reservoir of leverage tomorrow.
Trading partners should read the record accordingly. The European Union's restored, even record, flows look as much a reward for restraint as a return to normal. Were Brussels to press ahead with sweeping import restrictions on Chinese goods, its manufacturers could find themselves on the American side of the ledger. For buyers everywhere, the lesson of the post-Busan data is not reassurance but a sharpened incentive to source rare earths beyond China or innovate to do without them. The bazooka was lowered not surrendered, and surely every affected trading partner and corporate boardroom now knows it.
1. Introduction and point of departure: The Busan Accord
On 30 October 2025, President Trump and President Xi met at Gimhae air base near Busan, South Korea, on the margins of the Asia-Pacific Economic Cooperation summit, and reached a trade truce of one year subject to review at twelve-month intervals [1,6]. The truce replaced an arrangement due to expire the following month, the lapse of which would have restored tariffs above 100 per cent [1]. Alongside the rare earth terms set out below, the agreement also covered tariffs related to fentanyl, port fees on shipping, semiconductor exports, agricultural purchases and the ownership of TikTok in the United States [1,6]. Subsequent reporting suggested that both governments viewed the arrangement as a temporary stabilisation mechanism rather than a permanent settlement of bilateral trade disputes [2].
The rare earth element of the truce concerned a regime that China’s commerce ministry had announced on 9 October 2025 [7]. That regime required foreign companies to obtain Chinese approval to export magnets containing at least 0.1 per cent by value of Chinese-origin heavy rare earths, or produced using Chinese extraction, refining or magnet-making technology [7]. It created a Chinese counterpart to the United States foreign direct product rule and was scheduled to take effect from 1 December 2025, with most licences for military end-users to be refused and semiconductor cases assessed individually [7]. The regime extended restrictions that Beijing had first introduced in April 2025 in response to United States tariffs [7]. The October announcement led the United States to threaten a further tariff of 100 per cent [5].
At Busan, China agreed to suspend implementation of this regime for one year and to begin issuing general licences for exports of rare earth metals and the magnets that contain them [1,10]. In exchange, the United States agreed to defer for one year the extension of its export control list to the subsidiaries of listed entities, a step that would have added thousands of Chinese groups to its trade blacklist [1,6]. Details of the truce were negotiated by the United States Treasury secretary and the Chinese vice-premier in Malaysia in the preceding week [6].
2. Commercial significance of the suspended export regime
China accounts for 70 per cent of rare earth mining, 90 per cent of separation and processing, and 93 per cent of magnet manufacturing [7,8]. In 2024 China held about three-quarters of the global market for neodymium-iron-boron magnets, and the United States supplied approximately 3 per cent [8]. Rare earth magnets are inputs to products including smartphones and electric vehicles, and to defence systems including the F-35 aircraft, Tomahawk missiles, radar systems and drones [5,7].
The April 2025 restrictions produced delays in vehicle production and led companies to build stocks of the materials [5]. Some manufacturers held about one week of magnet inventory [3]. Suzuki suspended production of one model in Japan [4], and carmakers in India reduced output [3].
The October 2025 measures extended the controls in three respects. First, they applied to magnets produced outside China that contained Chinese-origin material above the 0.1 per cent threshold or that used Chinese process technology, which brought firms in third countries within the scope of Chinese approval [5,7]. Second, they restricted the transfer to non-Chinese parties of the technology used to extract, refine and manufacture magnets, which raised the cost to other countries of establishing independent production [5]. Third, they directed the refusal of most licences for military end-users [7].
The effect on European manufacturers was pointed out by the German automotive association, which reported consequences for deliveries to Germany and Europe [5]. The European Union Trade Commissioner reported that China approved 50 per cent of licence applications in October and that the documentation requirement exceeded processing capacity. Carmakers increased orders to a German magnet producer by a factor of two to three.
In the defence sector, one analysis stated that, if implemented, the measures removed trace amounts of Chinese-origin material from foreign military capabilities [5]. A producer of drone propulsion motors reported that the controls could delay production, raise costs and require redesign and alternative sourcing. One United States contractor reported increased procurement and inventory; one United Kingdom contractor reported no effect on its operations at that time [5].
The regime also extended to semiconductors. One assessment found that, if enforced, the rule could require Chinese approval for the export of a United States processor manufactured in a United States facility and sent to a United States laboratory [7]. Had China’s new export regime for rare earths not been suspended, the stakes for many advanced manufacturers in the West and Japan would have been significant.
3. So what actually happened after Busan?
The truce committed China to issue general licences for rare earth exports [9,10]. On 4 December 2025, China’s commerce ministry stated that it was issuing such licences and approving applications for civilian use. European Union officials reported that the approval rate had risen to about 75 per cent, from 50 per cent in October. The licences are stated to run for one year and to specify a volume per customer. Reports indicate that the system applies to established buyers with prior purchasing records and benefits established producers and their regular clients, while it does not change the application process for smaller producers [10].
These statements describe the licensing mechanism but do not establish the volume of exports delivered under it. The following section addresses that matter using export volumes reported by China Customs for November 2025 to April 2026, set against the same months in the four preceding years. This data was accessed from the reputable Trade Data Monitor service.
4. The factual record on Chinese exports of rare earths since Busan
Reported monthly trade levels in rare earth metals[1] and magnets are volatile,[2] so care is needed in constructing a sensible, like-for-like comparison upon which to assess official Chinese export decisions. Given that stated government motives need not reflect actual intent, and in the absence of detailed data at the firm level on licences to export rare earths, third-party analysts are left with recorded levels of the volume and value of rare earth exports to work with.
Caution is merited when interpreting recorded trade flows of this nature. For example, the total amount of rare earth exports licensed by Beijing may exceed the amount shipped. In that case, the policy stance may appear more restrictive than was actually the case. Also, shipment levels will be influenced by the strength of demand in the buying jurisdiction. Indeed, allowed shipment levels may fall short of total requests from foreign buyers.[3] Moreover, to the extent that smuggling or deliberate customs-code misclassification took place, these might give the impression from recorded export data that policy was stricter in practice than was the case. With these concerns laid out, the analysis proceeds with official Chinese export data.[4]
4.1 Method: Defining a Benchmark
This analysis compares the volume of Chinese rare earth exports of metals and magnets during the window November 2025 to April 2026, the longest period for which trade data is available after the Busan Accord, with the volumes recorded in the four preceding windows of the same six calendar months: November 2021 to April 2022, November 2022 to April 2023, November 2023 to April 2024, and November 2024 to April 2025. For each major export destination and each product, the four preceding windows define a benchmark.
The benchmark average employed here is the mean of the four window volumes and is set to an index of 100. The benchmark range is the interval between the minimum and the maximum of the export volumes for the four earlier windows. The November 2025 to April 2026 volume is expressed as an index of the benchmark mean (each of which is set to 100) and is classified as below the range, within the range, or above the range.
The comparison is presented for the world total of export volumes and for the following six export destinations: the United States, the European Union (the aggregate of the 27 member states), Japan, South Korea, ASEAN (the aggregate of its member states) and the United Kingdom. Since the relations between China and the respective governments in these export destinations differ, this approach will reveal whether strained diplomatic relations are associated with lower observed levels of receipt of Chinese rare earth metals and magnets.
4.2 Data
The export volumes analysed here are reported by the General Administration of Customs of the People’s Republic of China under the eight-digit subheadings of HS 280530, which cover rare earth metals, scandium and yttrium. Volumes are expressed in kilogrammes, which permits comparison across products. Sections 4.3 to 4.5 refer to metal subheadings; Section 4.6 adds the finished magnet, reported under HS 85051110. The data assembled here does not cover rare earth oxides and compounds, which are classified under HS 2846.
The benchmark uses the same six-month window in each year, which holds constant the seasonal pattern of trade flows. The four years before the agreement record the volumes that occurred before the Busan Accord took effect and after the major impact of the COVID-19 pandemic. Central to the approach is whether the post-Busan export volume recorded lies inside the range defined by the four windows before Busan. The index values reported scale the extent of any departure from the pre-Busan mean.
The charts reported here were deliberately designed so that the reader can quickly see whether recent export volumes departed markedly from the pre-Busan range.[5] Moreover, the cases where the range of pre-Busan export volumes is enormous are also evident. Of particular interest, given the accusations levelled from time to time that Beijing has cut off rare earth exports to a particular foreign economy, is whether the pre-Busan range also included zero recorded shipments in any one November-to-April interval. A final, distinct observation is that the recorded export volumes are sometimes very small, so some index values can be very high.
Table 1. Growth of Chinese world export volumes: benchmark-period compound annual growth and the post-accord change, by product.
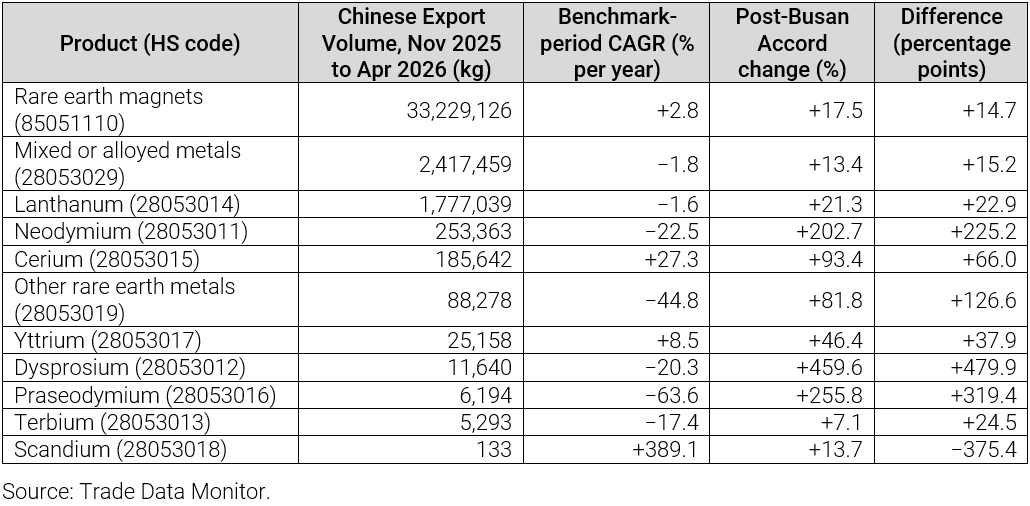
Table 1 sets out the compound annual growth rates of Chinese world export volumes over the benchmark period against the change observed since the Busan Accord. The benchmark column is the compound annual growth rate (CAGR) between the first and last benchmark windows; the post-accord column is the change from the November 2024 to April 2025 window to November 2025 to April 2026. For every rare earth product shipped by China the post-Busan Accord volume was higher than in the preceding window. For every product except scandium the post-accord growth exceeded the benchmark-period CAGR.
Rare earth magnets rose 17 per cent in volume terms since the Busan Accord. The two largest metal categories, mixed or alloyed metals and lanthanum, rose 13 and 21 per cent, respectively, against benchmark trends of near-zero export volume growth. Scandium is the one exception to the finding that export volumes delivered were higher post-Busan. Scandium’s benchmark CAGR is so large because the export volume in the first window was just one kilogramme. Since Busan, China exported 133 kilogrammes of scandium.
4.3 Chinese export volumes worldwide
When it comes to the volumes exported globally, as Figure 1 below shows, every product lies within or above its benchmark range and none lies below it. Three products lie above their benchmark ranges: dysprosium at an index value of 483, scandium 279 and cerium 190, implying significant expansions in the export volumes of some rare earth metals.
The post-Busan export volumes of the remaining products lie within the pre-Busan range. For November 2025 to April 2026 the export volume index for neodymium stands at 131, yttrium at 122, lanthanum at 118, mixed or alloyed metals at 99, terbium at 73, praseodymium at 60 and other rare earth metals at 50.
The world volume of dysprosium, a heavy rare earth metal used in magnets, reached 11,640 kilogrammes against a benchmark mean of 2,409 kilogrammes. On this aggregate measure, following the Busan Accord, China did not reduce its exports below the prior four-year range for any rare earth metal.
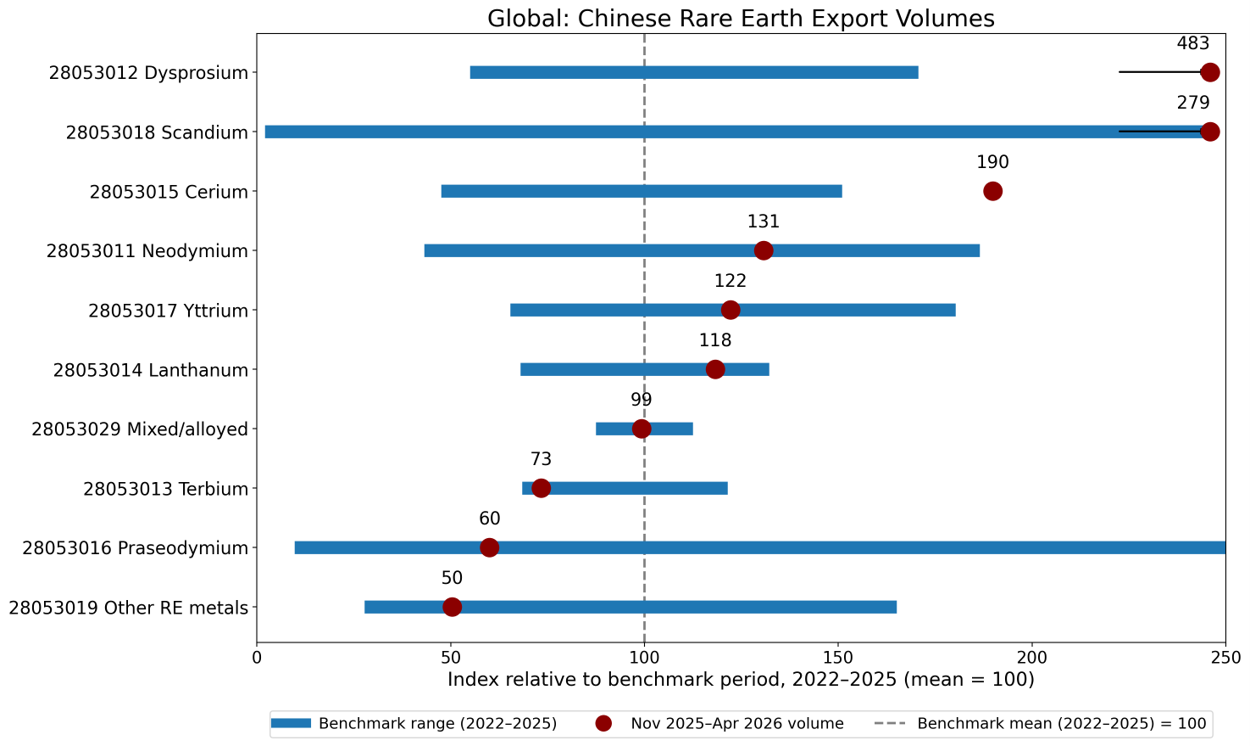
Figure 1. World total: November 2025 to April 2026 volume indexed to the four-year benchmark.
4.4 Chinese export volumes to major foreign economies
In this subsection the facts are stated; interpretation follows in Section 5.
United States
The United States is the only major destination for Chinese rare earth metals where every product-level export volume index lies below 100. Moreover, three products lie below the benchmark range: mixed or alloyed metals at an index of 40 (67,000 kilogrammes shipped since Busan against a range minimum of 89,150), other rare earth metals at 0.7 (45 kilogrammes shipped since Busan against a minimum of 235) and yttrium at 0 (0 kilogrammes shipped since Busan against a range minimum of 1,000).
Five products record zero export volume since Busan: neodymium, dysprosium, terbium, cerium and yttrium. For neodymium, dysprosium, terbium and cerium, the benchmark minimum is also zero, so the value lies within the range. Scandium and lanthanum volumes received from China post-Busan lie below the mean but within the pre-Busan range, not below it.
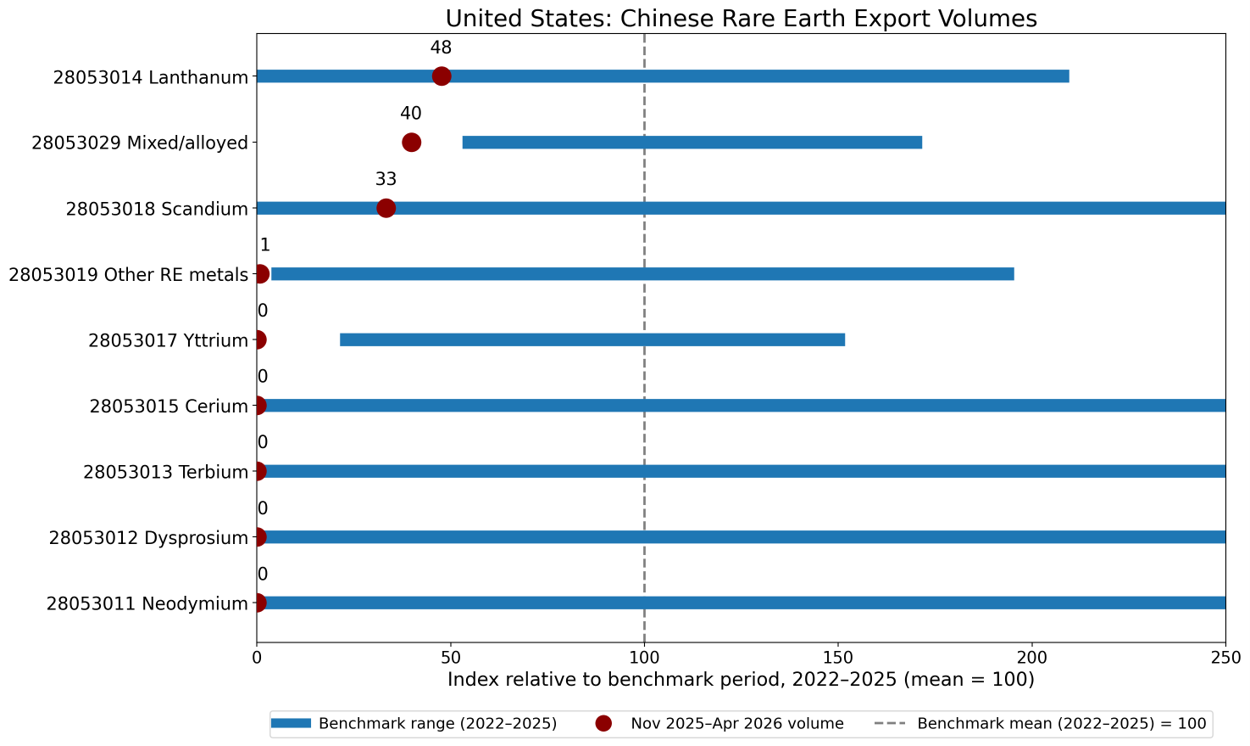
Figure 2. United States.
European Union
All nine rare earth metals shipped by China saw post-Busan export volumes lie within or above the benchmark range. In no case does the post-Busan export volume index fall below 85. Moreover, Chinese shipments of five rare earth products lie above the pre-Busan range: the export volume index for dysprosium lies at 8,163 (1,000 kilogrammes against a benchmark mean of 12), terbium at 520, scandium at 476, cerium at 233 and yttrium at 178. The four within the range are other rare earth metals with an export volume index of 162, mixed or alloyed metals at 114, neodymium at 103 and lanthanum at 85. The two heavy rare earth metals used in magnets, dysprosium and terbium, lie above the range.
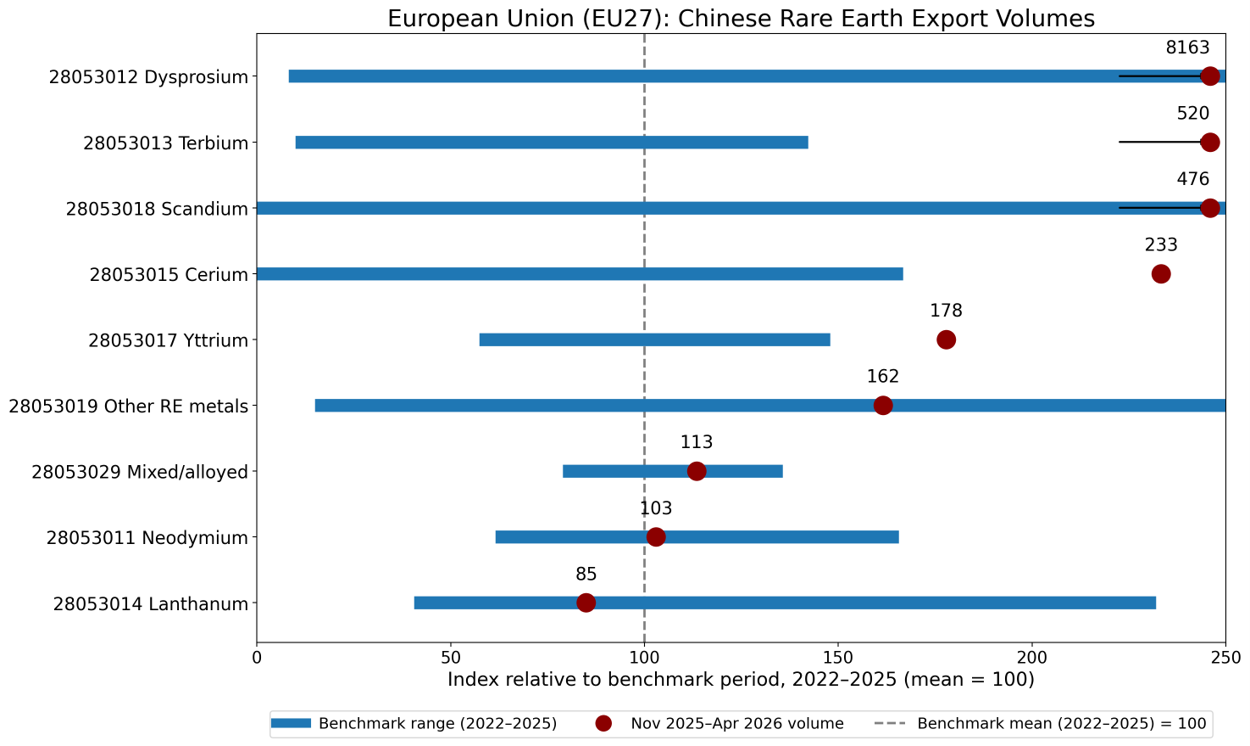
Figure 3. European Union (member countries present in the data).
Japan
Only one product of the ten rare earth metals considered here saw post-Busan export volumes fall below the benchmark range: mixed or alloyed metals with an index value of 72 (656,605 kilogrammes against a range minimum of 697,005). In contrast, two rare earth metals saw exports above the pre-Busan range: cerium, at 10,120 kilogrammes against a benchmark mean of 63, and scandium, at an index value of 308. The remaining seven metals saw export volumes post-Busan lie within the range, including neodymium with an index value of 86, dysprosium at 113 and terbium at 48. Other rare earth metals (43) and praseodymium (22), also below the mean, lie within the range, not below it.
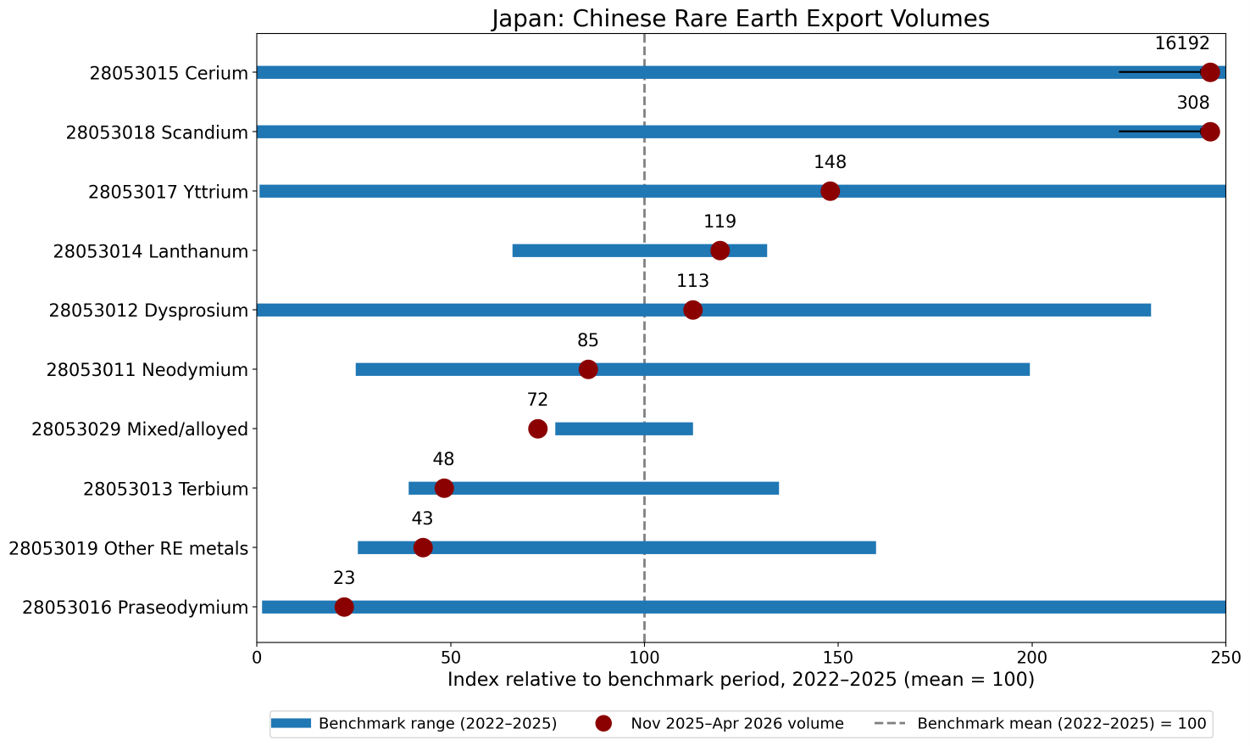
Figure 4. Japan.
South Korea
Since Busan, Chinese export volumes of one rare earth metal lie below the benchmark range: other rare earth metals with an index value of 86 (here 7,097 kilogrammes were shipped compared with a benchmark minimum of 7,292).
In contrast, three rare earth metals saw recent shipments from China above the pre-Busan benchmark range: dysprosium, praseodymium and terbium. Dysprosium reached 5,105 kilogrammes against a benchmark mean below one kilogramme, and praseodymium reached 52 kilogrammes against a benchmark mean below one kilogramme; these are volumes that did not occur in the four preceding years. The remaining five products lie within the range, including neodymium at 95 and mixed or alloyed metals at 109. Cerium and yttrium also saw recent export volumes below the pre-Busan mean but they lie within the benchmark range, not below it.
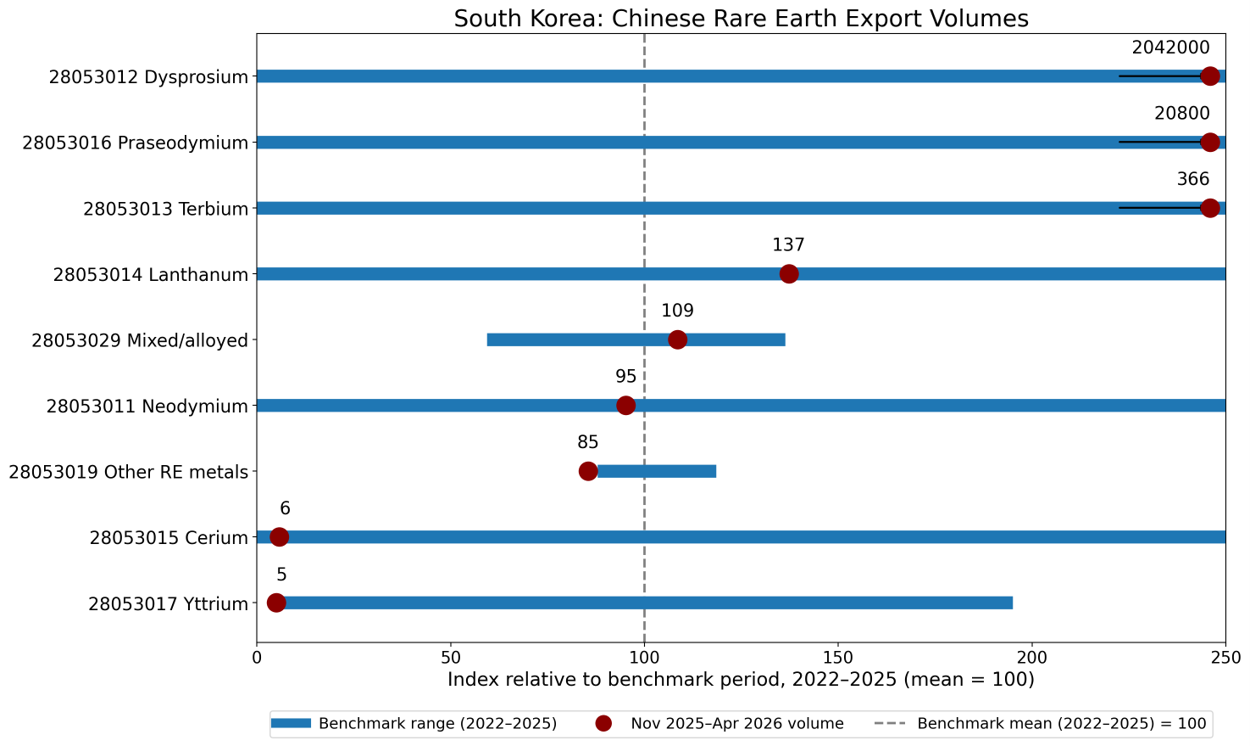
Figure 5. South Korea.
ASEAN
Only four rare earth metals recorded exports to ASEAN in both the benchmark and post-Busan periods, permitting a like-for-like comparison.[6] Three involve post-Busan export volumes well above the benchmark range: neodymium stands out with an export volume index of 475 (95,000 kilogrammes against a benchmark mean of 20,000), praseodymium’s index takes the value of 400 and mixed or alloyed metals stands at 233. Lanthanum lies within the range at 167. The two metals used as magnet feedstock (neodymium and praseodymium) were sent in such quantities since Busan that they exceed the prior four-year range.
None of the four rare earths shipped to ASEAN saw export volumes since Busan that fell below the corresponding mean witnessed before Busan.
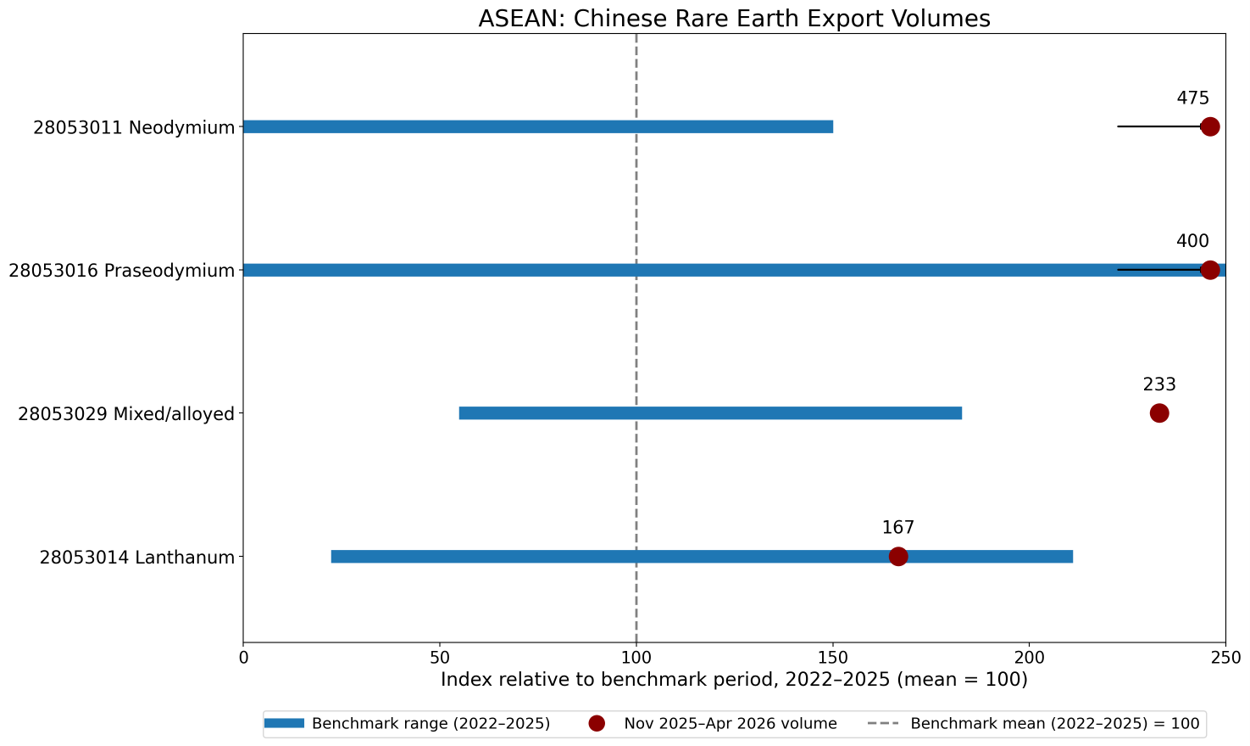
Figure 6. ASEAN (member countries present in the data).
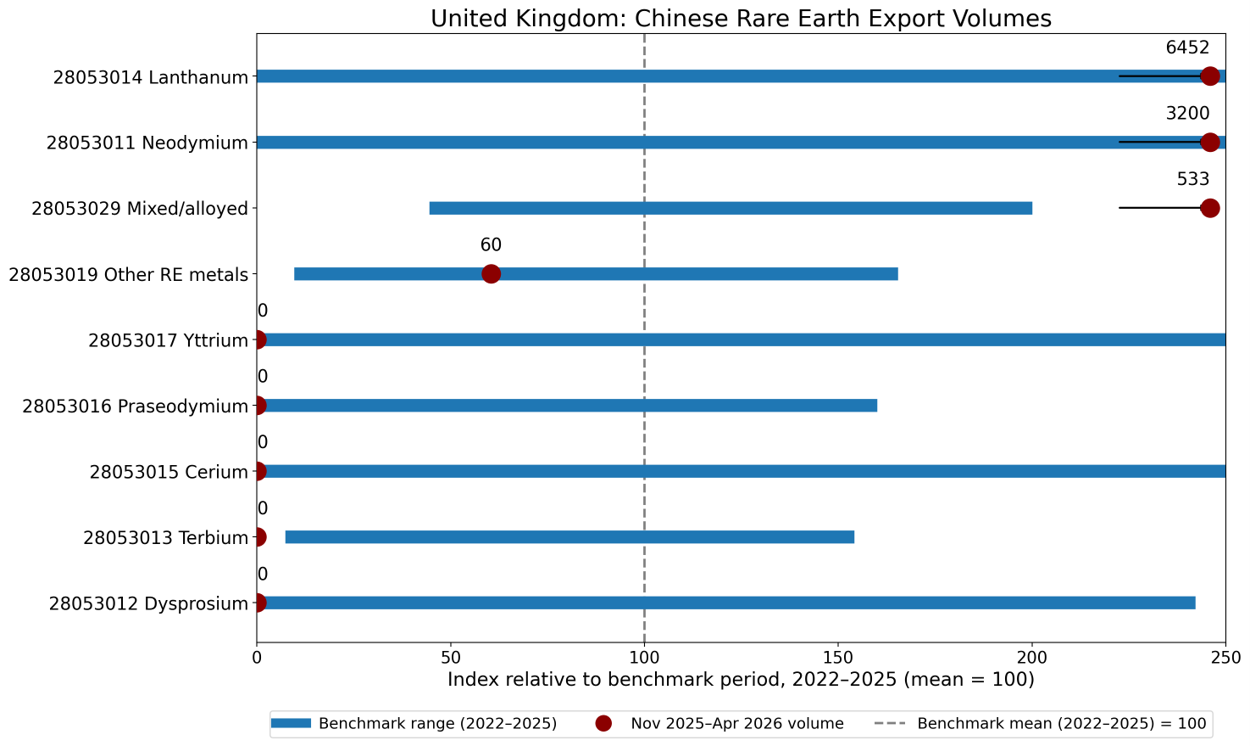
United Kingdom
Chinese rare earth volumes shipped to the United Kingdom since the Busan Accord vary markedly. The reported export volumes range from tens to tens of thousands of kilogrammes and differ between years. Such differences call for a product-by-product assessment.
Three rare earth metals saw post-Busan shipments that lie above the benchmark range: the export volume index for lanthanum stands at 6,452 (50,000 kilogrammes against a benchmark mean of 775), neodymium at 3,200 (8,000 kilogrammes against a mean of 250) and mixed or alloyed metals at 533.
One metal clearly lies below the range: terbium saw no shipments since Busan against a range minimum of 10 kilogrammes.
The remaining five products lie within their pre-Busan ranges: other rare earth metals have an export volume index of 60, and four products, dysprosium, cerium, praseodymium and yttrium, record zero shipments against ranges whose minimum is also zero. In short, receiving no shipments of these four products from China is not unprecedented.
4.5 Variation across destinations and products
The export destinations for Chinese rare earth metals divide into at least two groups. The United States is the one destination at which every rare earth metal index value lies below its respective benchmark mean. At the other end of the spectrum, the European Union and ASEAN received shipments from November 2025 to April 2026 within or above the pre-Busan range. Japan and South Korea occupy an intermediate position: they received shipments within or above range for at least eight of the rare earth metals considered here. The United Kingdom case has parallels to American experience, but with such volatile pre-Busan shipments firm conclusions are harder to draw in the former case than in the latter.
The two metals used in making permanent magnets illustrate the divergence. The neodymium export volume index is 0 for the recent shipments to the United States, 103 for the European Union, 86 for Japan, 95 for South Korea, 475 for ASEAN and 3,200 for the United Kingdom (compared with a worldwide post-Busan expansion of 31 per cent). The dysprosium export volume index is also 0 for the United States, but takes the value of 8,163 for the European Union and 113 for Japan. Meanwhile, worldwide shipments of dysprosium rose nearly fivefold after the Busan Accord. In both cases the United States records zero direct shipments while shipments worldwide rose.
4.6 Chinese export volumes of rare earth magnets
Do the findings for rare earth metals carry over to rare earth permanent magnets? Recall that export volumes of the latter are reported under HS code 85051110, measured in kilogrammes [12].
At the world level the post-Busan export volumes recorded lie above the four-year benchmark range. The export volume index of 125 implies a quarter more rare earth magnets were shipped post-Busan than in the four prior windows (33.2 million kilogrammes shipped against a benchmark range of 25.8 to 28.3 million kilogrammes). Four major export destinations received more: Japan’s export volume index lies at 150 (receiving 1.40 million kilogrammes against a range maximum of 1.18 million), the European Union index is at 136 (14.1 million kilogrammes against a range maximum of 11.3 million), South Korea at 129 (3.69 million kilogrammes against a range maximum of 3.19 million) and ASEAN at 122 (4.59 million kilogrammes against a range maximum of 4.25 million).
Magnets shipped to the United Kingdom lie within their pre-Busan range with an index value of 96 (314,000 kilogrammes within a range of 263,000 to 371,000). The United States is the one destination where recent shipments fall below the pre-Busan range, with an export volume index of 91 (3.06 million kilogrammes against a range minimum of 3.20 million and a benchmark mean of 3.35 million). The United States volume is 9 per cent below the pre-Busan benchmark mean and 4 per cent below the minimum witnessed pre-Busan.
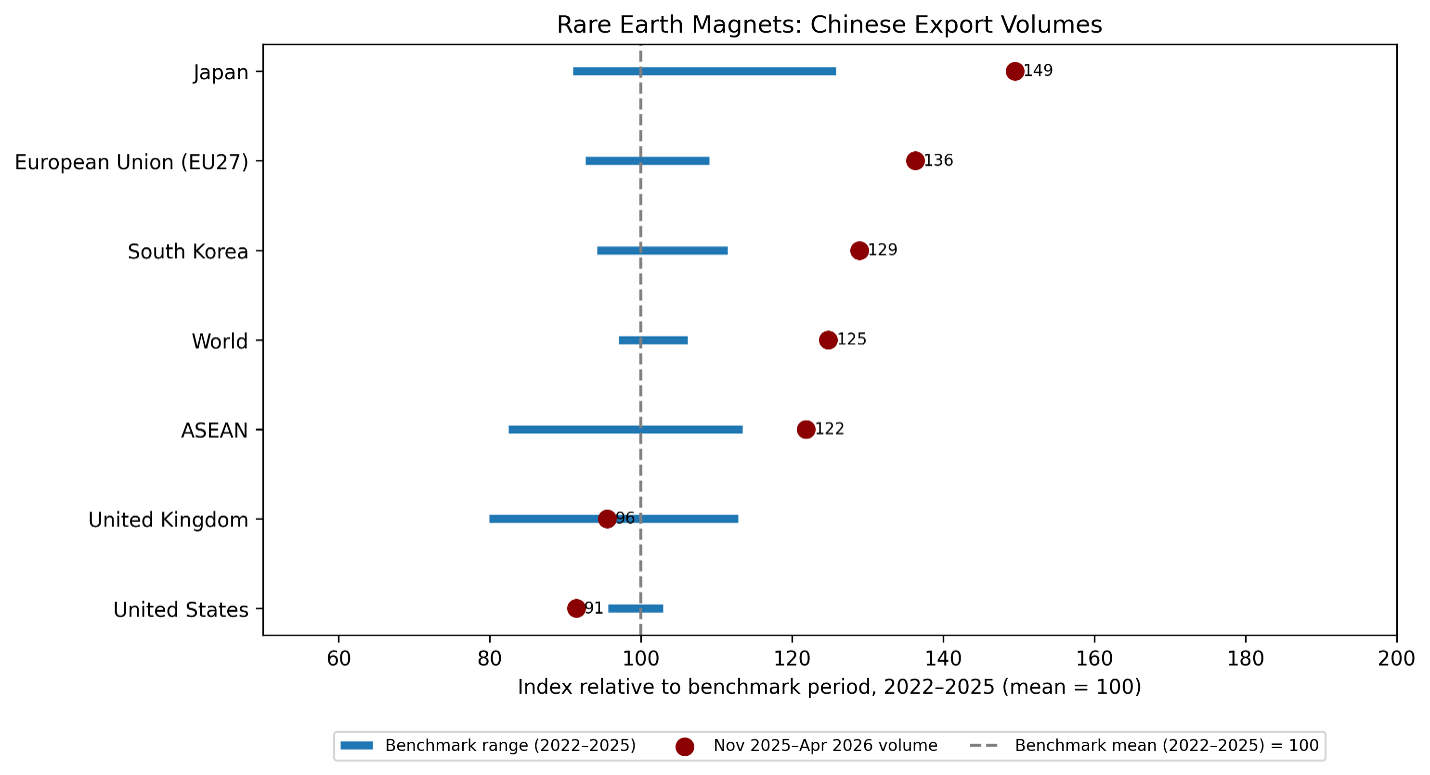
Figure 8. Rare earth permanent magnets (HS 85051110): November 2025 to April 2026 volume indexed to the four-year benchmark, by destination.
5. Assessment
Rare earth metals and magnets are major chokepoints of the world economy [13,14]. It matters what decisions China takes with respect to the supply of rare earths and that is why the record since the Busan Accord is so interesting. What do the facts laid out earlier reveal about Chinese economic statecraft?
Post-Busan China did not confine global export volumes of rare earth metals and magnets within the ranges witnessed earlier this decade. Aggregate Chinese shipments of rare earth metals either lie within or above the pre-Busan range. None lies below it. Recent Chinese supply of dysprosium, scandium and cerium is at least 90 per cent above the average levels typically seen. For finished magnets, Chinese supply to world markets since Busan is up 25 per cent.
Such aggregate evidence is at odds with claims that China leveraged its monopoly power over rare earths by reducing supplies to world markets. By threatening in 2025 to cut off supplies of rare earths to manufacturers abroad, China essentially reached for one of the bazookas of the trading system. In the event, this bazooka was brandished but not fired.
That said, there are clear differences in the volumes of rare earths received by China’s major trading partners. During November 2025 to April 2026, the European Union and ASEAN received shipments of every rare earth product within or above the benchmark range. Since the Busan Accord, four rare earth metals and magnets were shipped to the European Union in record quantities. China’s neighbours Japan and South Korea saw the volume of every product received within or above range in all but one case.
The volumes shipped to the United States are the potential exception. In the years running up to the Busan Accord, the volumes shipped from China were so volatile that it is difficult to detect many breaks in the supply pattern from November 2025 to April 2026.[7] Still, Chinese shipments to the United States of yttrium have ceased since Busan, shipments of mixed or alloyed rare earths are 60 per cent below the benchmark, and 9 per cent fewer rare earth magnets were received. In short, official Chinese export data does not confirm greater supply of rare earths to every export destination since the Busan Accord.
The observed differences in volumes received by China’s trading partners will almost surely be read differently in foreign capitals. American observers are likely to see uneven outcomes after Busan as evidence of discrimination, possibly viewed as delayed punishment for starting a second trade war with China. Such a negative view may be tempered by the small size of the magnet shortfall (9 per cent below earlier years). Even so, American observers may conclude they derived the least benefit from the rare earth provisions of the Busan Accord.
To the European Union the Chinese export record is, at the least, one of restoration of prior trade flows. Metals and magnets shipments were within or above range and the latter were at volumes well above those witnessed in prior years. European officials may want to reflect on whether such treatment is likely to change in the future should they follow through on recent proposals to impose far-reaching import restrictions on a range of Chinese exports.
To the ASEAN states, the Chinese record points to significant increases in supplies of neodymium, praseodymium and magnets. Whether such favourable treatment becomes a double-edged sword will no doubt concern some officials: they will be under no illusion about the distinction between unimpeded sourcing of rare earths from China and compliance with an export control regime.
To Japan and South Korea, despite strains in their relationships with Beijing, total volumes shipped from China from November 2025 to April 2026 departed little from previous years. Having written that, the volumes received by these two Chinese neighbours grew by less than those received by ASEAN and the European Union. If export volumes are the metric to go by, these two Chinese neighbours received more generous treatment than the United States.
Even though the total amounts supplied to world markets by China have increased since the Busan Accord, the marked differences in rare earth shipments across China’s major trading partners have the whiff of “divide and rule” tactics rather than just punishing the United States.[8] The fact that Chinese export volumes can change without warning serves to remind trading partners of the consequences for their advanced manufacturing sectors of antagonising Beijing, whether bilaterally or by aligning with others against it. When G7 leaders meet in Évian on 15–17 June 2026, they are expected to align further on "economic security" measures. European Union and Japanese leaders represent the very economies China has supplied most generously since Busan. The months that follow will test whether that favourable treatment survives further attempts to make common cause against Beijing.
While the greater shipments of rare earth metals and magnets witnessed since the Busan Accord will be welcomed by corporate buyers, the uncertainty generated by the discretion afforded to Chinese officials in their export control regime is a different matter. So long as that uncertainty remains, the incentives will strengthen to seek alternative suppliers of rare earth metals and magnets and to find ways to replace those inputs into production processes.
In sum, while the Chinese decision not to cut rare earth supplies to world markets since the Busan Accord is to be welcomed, the current system of export management is a far cry from the arm’s-length contracting between competitive, independently operating suppliers and buyers witnessed in many other sectors of world trade. The rare earths bazooka remains on the shelf for now.
References
[1] Sevastopulo, D. and Leahy, J. (2025) ‘US and China agree one-year trade truce after Donald Trump-Xi Jinping talks’, Financial Times, 30 October 2025.
[2] Sevastopulo, D. (2026) ‘Behind Trump’s truce with China’, Financial Times, 23 February 2026.
[3] Miller, C. (2025) ‘China’s weaponisation of rare earths is a new kind of trade war’, Financial Times, 8 July 2025.
[4] Leahy, J., McMorrow, R., Olcott, E. and White, E. (2025) ‘EU businesses lobby China for rare earths “fast-track” channel’, Financial Times, 5 June 2025.
[5] Inagaki, K., Pfeifer, S., McMorrow, R., Leahy, J. and White, E. (2025) ‘Western companies warn of China rare-earth supply chain chaos’, Financial Times, 14 October 2025.
[6] Sevastopulo, D. (2025) ‘China “made a real mistake” by “firing shots” on rare earths, says Scott Bessent’, Financial Times, 31 October 2025.
[7] McMorrow, R. and Sevastopulo, D. (2025) ‘China unveils sweeping rare-earth export controls to protect “national security”’, Financial Times, 9 October 2025 (updated 10 October 2025).
[8] McMorrow, R. and Liu, N. (2025) ‘China won the rare earths race. Can it stay on top?’, Financial Times, 28 August 2025.
[9] Leahy, J. (2025) ‘China’s Li Qiang pushes developing country alliance on rare earths’, Financial Times, 24 November 2025.
[10] Leahy, J., McMorrow, R. and Bounds, A. (2025) ‘China says it is “actively” issuing rare earths general licences’, Financial Times, 4 December 2025.
[11] Author’s compilation from export statistics of the General Administration of Customs of the People’s Republic of China, HS 280530 subheadings (rare earth metals), monthly data, 2021 to April 2026.
[12] Author’s compilation from Trade Data Monitor, Chinese exports under HS 85051110 (rare earth permanent magnets), monthly data, 2021 to April 2026.
[13] OECD (2024) Trade Impacts of Economic Coercion, OECD Trade Policy Paper No. 281, OECD Publishing, Paris.
[14] Fishman, E. (2025) Chokepoints: American Power in the Age of Economic Warfare. New York: Penguin Random House.
1
"Metals" is used deliberately. The products examined are the refined rare earth metals, scandium and yttrium of HS 280530, not rare earth ores or "minerals" (the mined raw materials), nor the compounds and oxides of HS 2846, which are excluded. The separately reported magnets (HS 85051110) are a manufactured good.
2
Monthly Chinese exports of rare earth metals exhibit substantial volatility and a pronounced degree of intermittency. Measured by the standard deviation of monthly log changes, volatility ranges from 0.70 for HS 28053029 to 3.83 for HS 28053016, with most product categories recording values well above 1.0. By comparison, the equivalent figure for rare earth magnets is approximately 0.25, implying that monthly fluctuations in rare earth metal exports are typically three to fifteen times larger than those observed for the downstream magnet industry. The most volatile product categories are also characterised by a significant incidence of zero-export months. For example, HS 28053016 recorded no exports in 23 out of 62 months (37 per cent of the sample), while HS 28053012 and HS 28053018 registered zero exports in 22 per cent and 26 per cent of months, respectively. In contrast, HS 28053014, HS 28053019 and HS 28053029 recorded exports in every month of the sample and were among the least volatile categories. Taken together, these findings indicate that trade in rare earth metals is frequently organised around sporadic shipments, inventory adjustments and periodic procurement cycles rather than continuous monthly supply. This stands in marked contrast to rare earth magnets, whose substantially lower volatility is consistent with their role as a downstream manufactured product embedded in more stable industrial supply chains and recurring production schedules. These findings caution against putting too much weight on any one month’s export data, the approach taken by some media reports in recent months. In short, given the nature of trade in rare earths, it is likely that a journalist can find individual months where China’s exports of a given item are zero, leading to potentially misleading news articles claiming that China has “cut off” a particular trading partner.
3
Export volume data is distinct from evidence on the number and origins of denied licenses to export rare earths. It is possible that recorded export volumes are rising while many requests for export licenses are denied. That conjecture cannot be evaluated with the data available to me.
4
Another concern is that the levels of rare earth imports by a trading partner may differ from the corresponding export flow recorded by China. As the codes in national Harmonized Systems are only aligned up to the six-digit level, there is only so far such checks can go. This is especially so once one appreciates that the month a good is exported from China may differ from the month it is imported by a trading partner. As will become evident, here the HS codes for individual rare earth metals are at the eight-digit level of classification.
5
A product only appears in a chart if post-Busan Chinese export volumes can be benchmarked against a pre-Busan shipment history. Observing zero post-Busan export volumes is not a reason for excluding a product from the charts that follow, as will become evident in the results for some Chinese trading partners.
6
Three further metals were shipped to ASEAN during November 2025 to April 2026 but do not appear in Figure 6: dysprosium (3,500 kilogrammes), terbium (600 kilogrammes) and cerium (500 kilogrammes). Each is omitted because no shipments were recorded in any of the four preceding windows, so no benchmark exists against which to index the post-Busan volume. As dysprosium and terbium are among the heavy rare earths used in magnets, these newly opened flows, if anything, reinforce rather than qualify the evidence of expanded supply to the region.
7
The findings for the United Kingdom also reveal a wide range of volumes supplied during the benchmark years, so much so that no break in Chinese export behaviour was detected. Still, during November 2025 to April 2026 China did not supply the United Kingdom with five of the rare earth metals.
8
Recall, as noted on page 5, other factors can affect observed export volumes.