


With the release of the September 2026 official Chinese export data it is now possible to breakdown the 38% year-on-year value increase into rising export prices and rising volumes (central to "flood" narratives). Whether this standout export growth is broad-based or concentrated in a limited range of products is also discussed, along with the relevance for the China Shock 2.0 narrative.
Authors
Simon Evenett
Date Published
22 Oct 2026
Related Topics:

Now that detailed official Chinese export data for September 2026 are available, a breakdown of the recent acceleration in exports of manufactured goods is possible. Monthly year-on-year export totals attract a great deal of attention, so Section A examines the change in manufactured exports between September 2025 and September 2026.
Section B compares the 12 months from October 2025 to September 2026 with the two previous 12-month periods. Monthly trade data are volatile; comparing 12-month periods smooths this out. What follows first are the main findings of both sections
Main findings for September 2026 compared with September 2025:
-
September’s jump in exports of Chinese manufactures was led by prices. Manufactured export value was 37.8% higher than a year earlier. Higher prices contributed about 22 percentage points of that, and higher volume about 16. (Figure 1, Table 1)
-
More than half (51%) of the year-on-year rise in September’s manufactured exports came from just two product groups: AI-exposed goods and low-carbon goods. Consumer goods, said to be deflected to foreign markets due to depressed consumption spending at home, contributed only 10% of the rise. (Table 1)
-
AI-exposed goods’ export gain was almost all price. AI-exposed goods supplied 37% of the September increase. Their prices rose 153%, while the amount shipped rose by 3%. (Table 1)
-
Elsewhere, more goods were shipped. In four of the other five product groups, rising volume mattered more than rising prices; capital goods were the exception. Low-carbon goods led with volume up 43%. (Table 1)
Main findings over the past three years (October 2023–September 2026):
-
Export prices turned up as volume growth slowed. Over the 12 months to September 2026, export value rose 17.6%. Export prices rose 9.4% after two years of falls. Export volume growth slowed for the second year running, to 7.9%. (Table 2, Figures 2–3)
-
AI-exposed goods: export values rose mostly due to higher prices. AI-exposed goods accounted for 43% of the 12-month increase in export value. Their prices rose 88%, while the volume shipped rose only 5%. (Figure 4, Table 3, Figure 5)
-
Low-carbon volumes are accelerating. Low-carbon goods have the fastest volume growth of any group, and it is speeding up: from 17% two years ago to 28% in the latest 12 months. Their prices have only just stopped falling. (Table 3, Figure 6)
-
The price rise is concentrated in a small number of Chinese manufactures. The top 10 products supplied 60% of the increase in export value. Without them the average export price of other manufactures rose 1.6%. Over 12 months, consumer goods prices are still falling. (Table 4, Figure 7, Table 3)
-
Rising Chinese export prices and volumes increasingly go together. Manufactured products whose export prices and volume both rose now account for two-thirds of the gross change in export value (rises and falls added together), up from a third a year earlier. Even so, the most common pattern across products is still falling prices with rising volume. (Figures 8–9)
-
New data raise questions about the China Shock 2.0 narrative. Much of the acceleration in Chinese export value in 2026 comes from higher prices for a few AI-exposed goods, not from an across-the-board surge in shipments. Export volume is still growing, but more slowly each year: from 12.6% to 10.5% to 7.9% over the last three 12-month periods. The exception is low-carbon goods, whose volume growth is speeding up. Chinese manufactured exports with falling prices and rising volume now account for under a fifth of the gross change in export value, against nearly half a year earlier. Even so, outside the top 50 products, export prices are flat or falling. Beware one-size-fits-all explanations of exports of Chinese manufactures. (Tables 2–4, Figures 7–8)
Simon J. Evenett is Professor of Geopolitics & Strategy, IMD Business School, Lausanne, Switzerland; Co-Chair, Trade & Investment Council, World Economic Forum; Founder, St. Gallen Endowment for Prosperity Through Trade, the institutional home of the few remaining independent trackers of digital, trade, industrial, subsidy and investment policy.
Data sources and index calculations
All figures are China Customs exports of manufactured goods (HS chapters 28–96, excluding 71) in US dollars as assembled by the highly reputed Trade Data Monitor. AI-exposed goods are products associated with compute and memory, defined by eight HS codes: chips (854231 processors, 854232 memory, 854239 other), processing units (847150), computer systems (847149), storage (847170, 852351) and computer parts (847330). The IMF list of low-carbon goods (124 HS 2017 codes, converted to 138 HS 2022 codes) was used plus 3 HS codes for electric and hybrid trucks (141 in total). HS 2022 variant of the UN Harmonized System of Products used throughout. Export flows from China at six-digit level of product disaggregation used. Section A compares September 2026 with September 2025 and each month with the same month a year earlier. Section B compares 12-month periods with the previous 12 months. Export prices and export volume are Törnqvist indices, with the volume of each HS code measured in its World Customs Organization standard unit.
Section A. Changes from September 2025 to September 2026
Figure 1. Growth in export value on the same month a year earlier, split into export volume and export prices
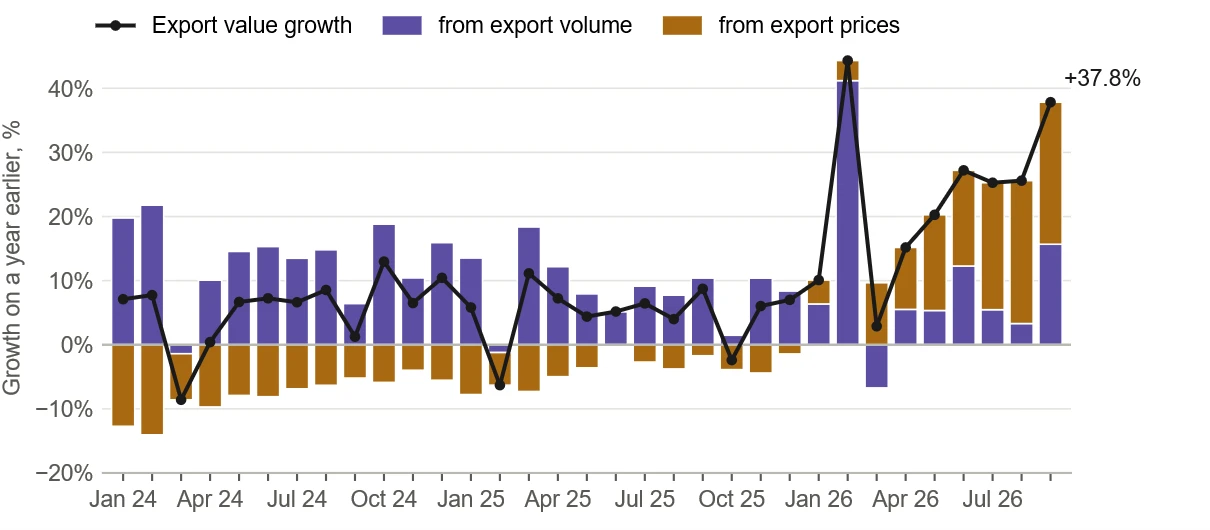
Bars: contributions in percentage points, adding up to export value growth. The price part includes a small residual (at most 1.8 points). January–March comparisons are affected by the timing of Lunar New Year.
Table 1. Export value, export volume and export prices by product group, September 2026 on September 2025
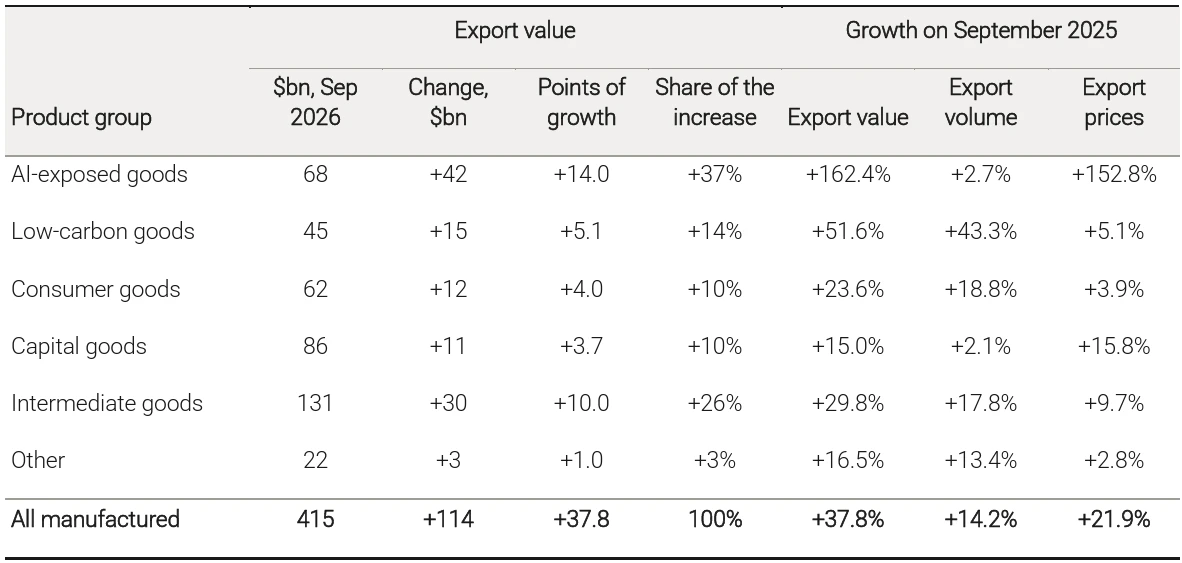
Points of growth: each group’s contribution to the 37.8% growth in export value. Volume and price growth multiply, not add, to value growth, and are measured on codes with standard-unit quantities. Product groups as in Table 3
Section B. Changes over the last three 12-month periods
Question 1. What drives growth in export value: export volume or export prices?
Table 2. Export value, export volume and export prices, three 12-month periods
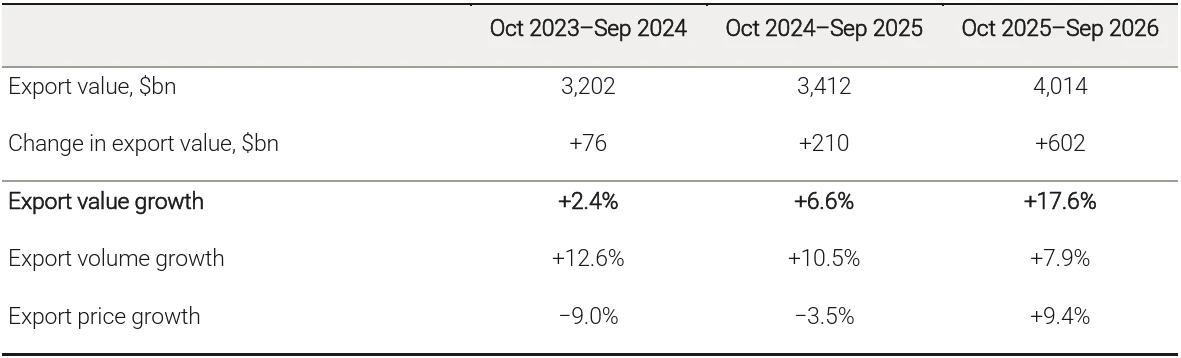
Growth over the previous 12 months.
Figure 2. Export value, export volume and export prices
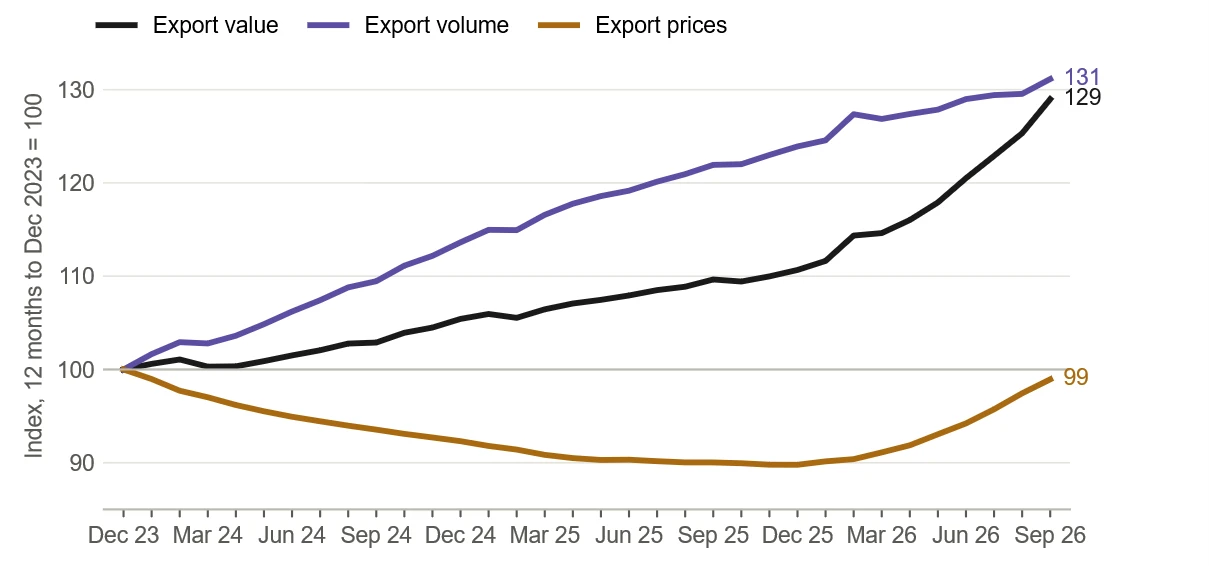
12-month moving averages.
Figure 3. 12-month change in export value, split into export volume and export prices ($bn)
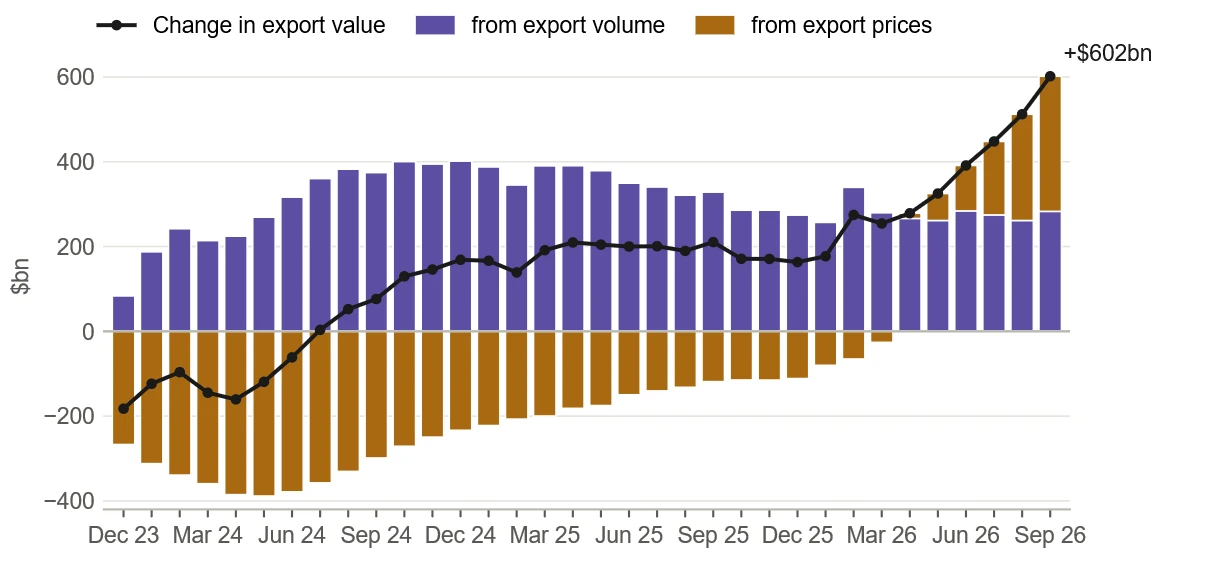
Each bar: 12 months to the month shown, on the previous 12 months. The price part includes a small residual (at most $13bn).
Question 2. Which groups of products account for the changes in export value, volume and prices?
Figure 4. Contribution of each product group to the 12-month change in export value
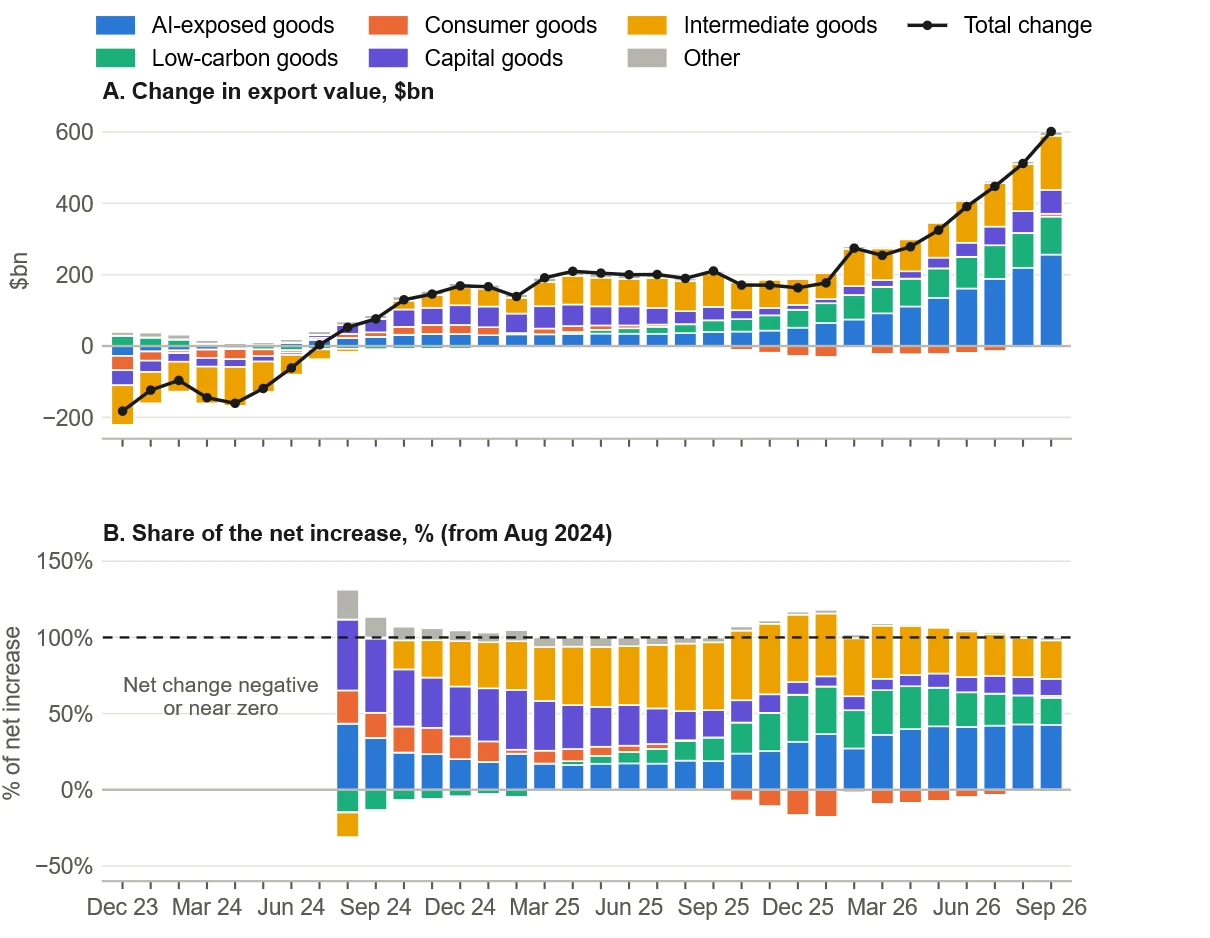
Panel B starts in August 2024. Before then the net change was negative or close to zero, so shares of it are not meaningful. Other: codes with mixed end use (including combustion-engine cars) and unclassified codes.
Figure 5. Export prices by product group
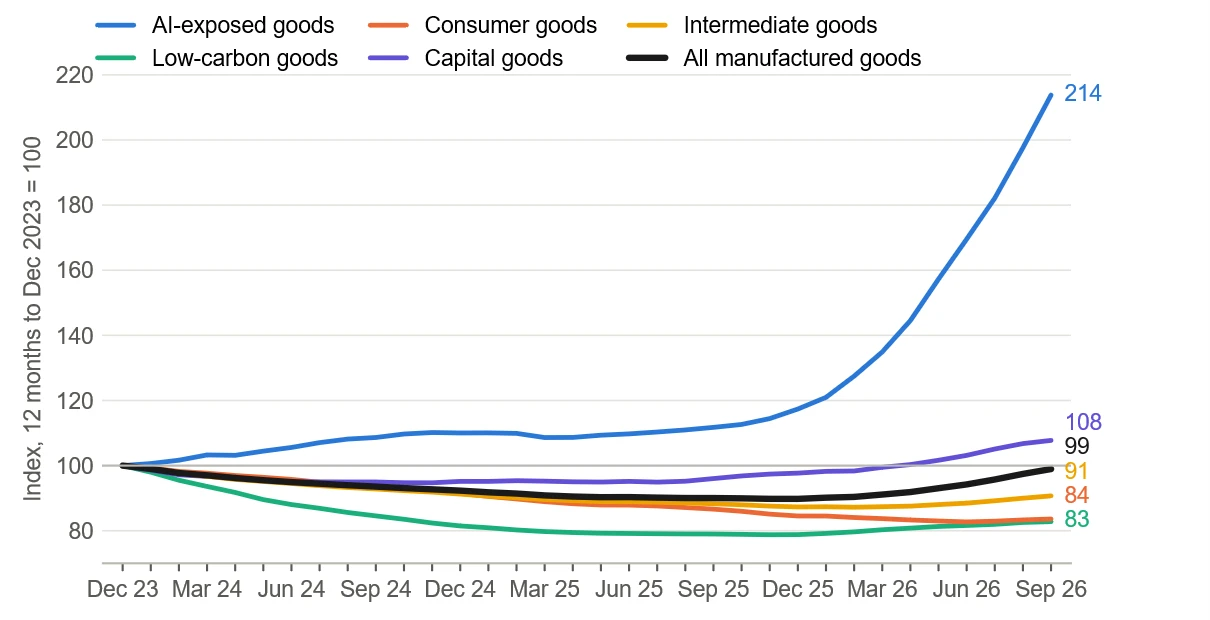
12-month moving averages.
Figure 6. Export volume by product group
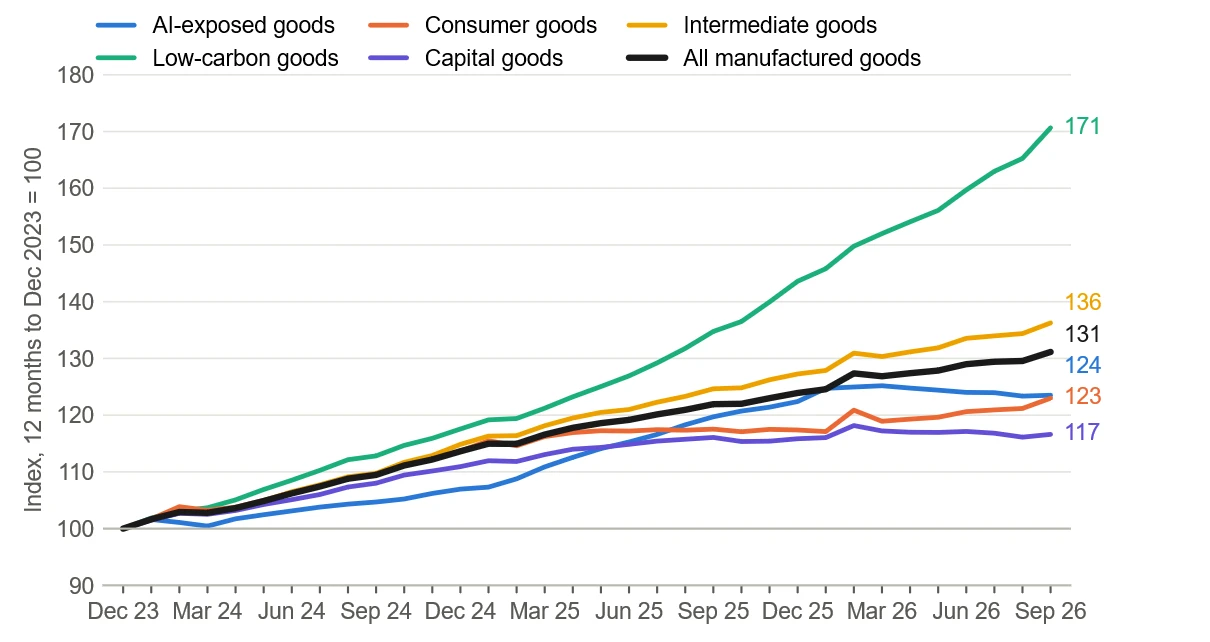
12-month moving averages.
Table 3. Export value, volume and prices by product group
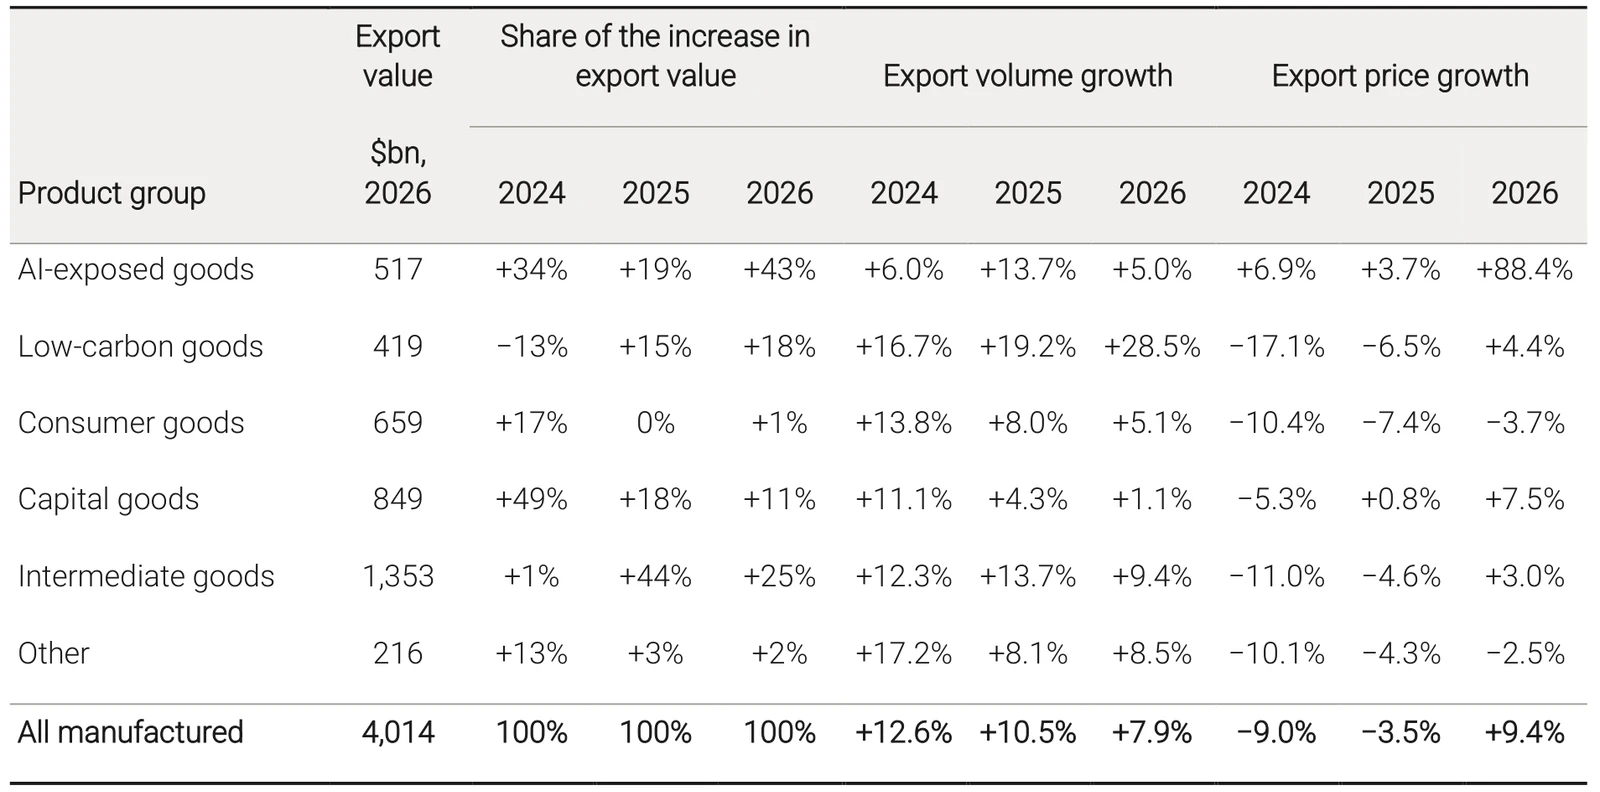
12 months to September of each year, growth compared to the previous 12 months. By construction, these groups do not overlap. AI-exposed goods: products associated with compute and memory (eight HS codes, listed in the box on page 2). Low-carbon goods: IMF list, plus electric and hybrid trucks. Consumer, capital and intermediate goods identified using UN Broad Economic Categories for the remaining codes. Other: codes with mixed end use (including combustion-engine cars) and unclassified codes.
Question 3. How concentrated is the growth in a small number of products?
Table 4. Concentration of the increase in export value in the largest 100 contributors
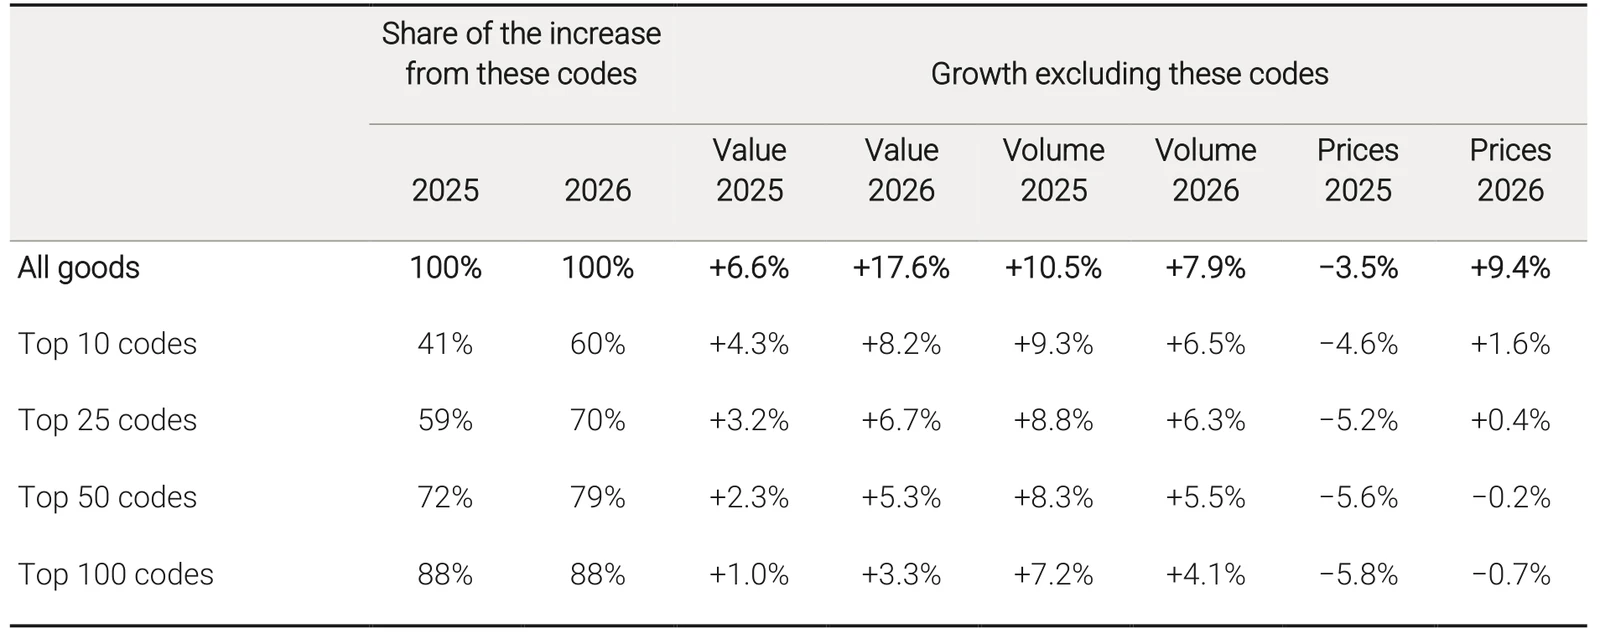
HS six-digit codes ranked by their increase in export value in each 12-month period (to September 2025 and to September 2026), out of 4,254 codes exported in each period.
Figure 7. Export price growth, all goods and excluding the largest 10, 25, 50 and 100 contributors
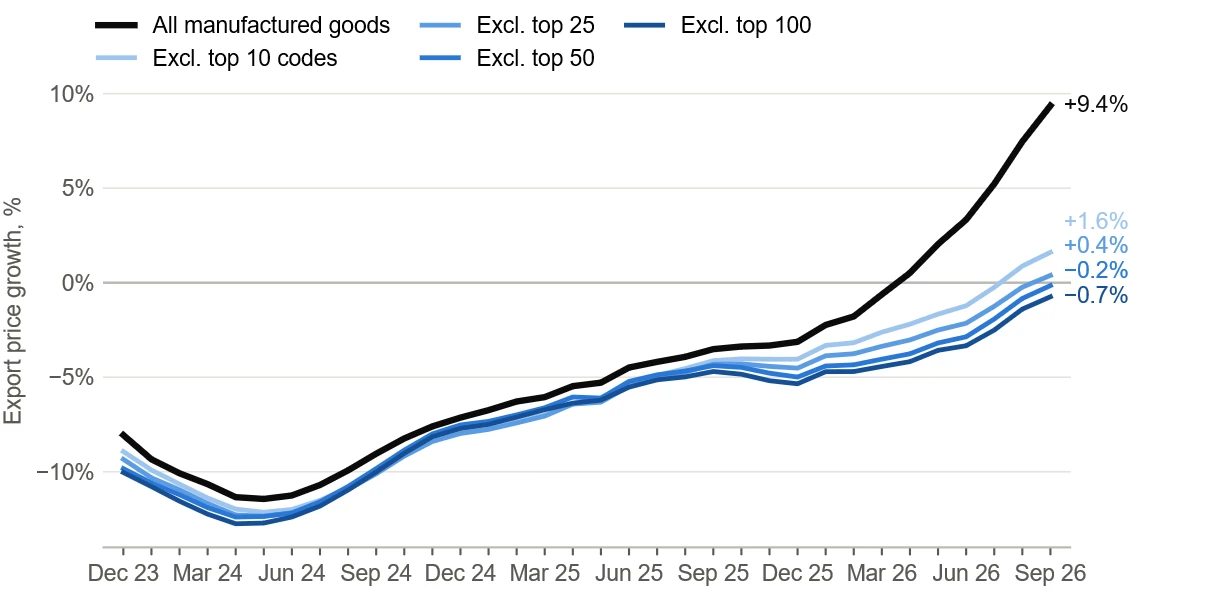
Excluded: the HS codes with the largest increases in export value in the 12 months to September 2026. Growth over the previous 12 months.
Question 4. How are the changes spread across products whose prices and volumes rose or fell?
Figure 8. Gross change in export value, by direction of export prices and export volume change
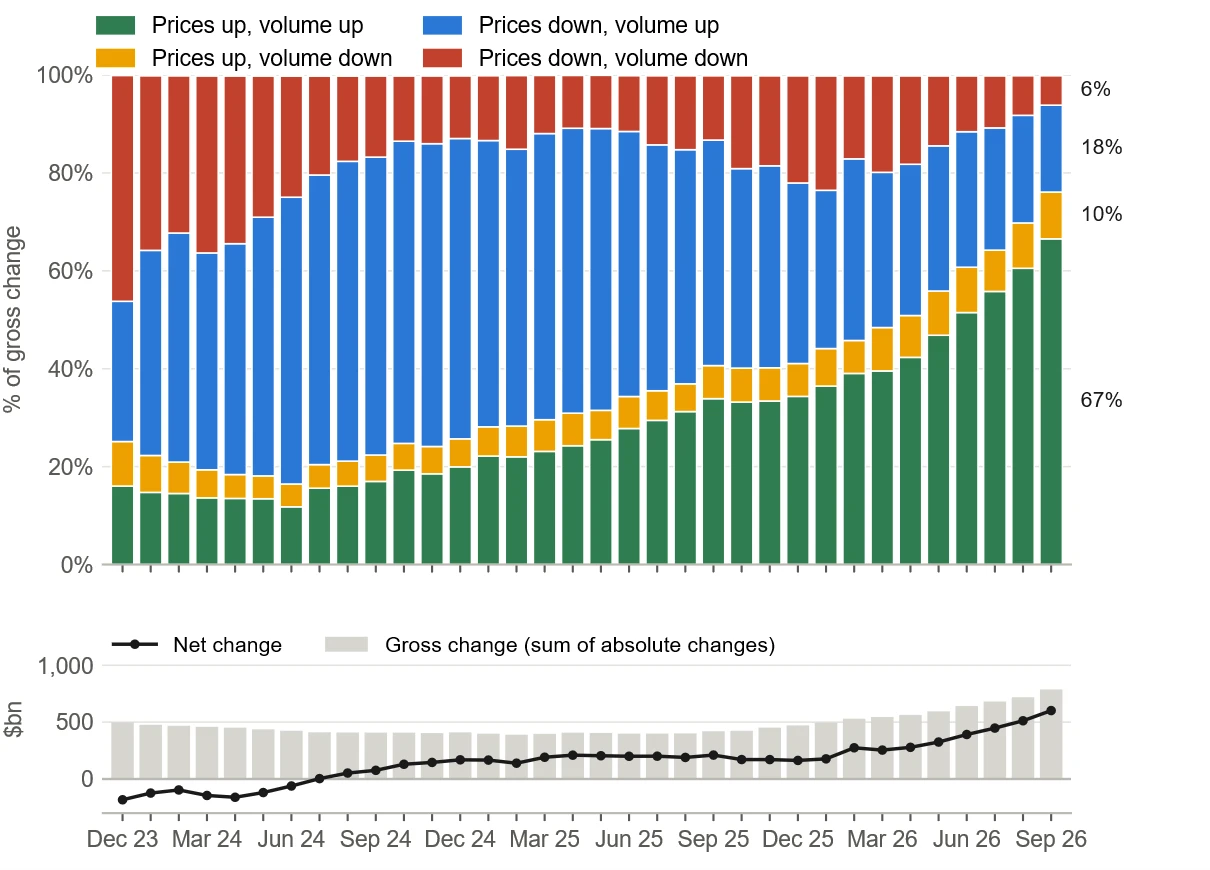
Gross change: the sum of the absolute changes in export value across HS codes. Each code is classified by the direction of its export price and export volume over 12 months on the previous 12 months. Grey (0.1% of the gross change in the 12 months to September 2026; at most 0.2% in any period): codes that cannot be classified (exported in only one of the two periods, or without a standard-unit quantity).
Figure 9. HS codes by direction of export prices and export volume change
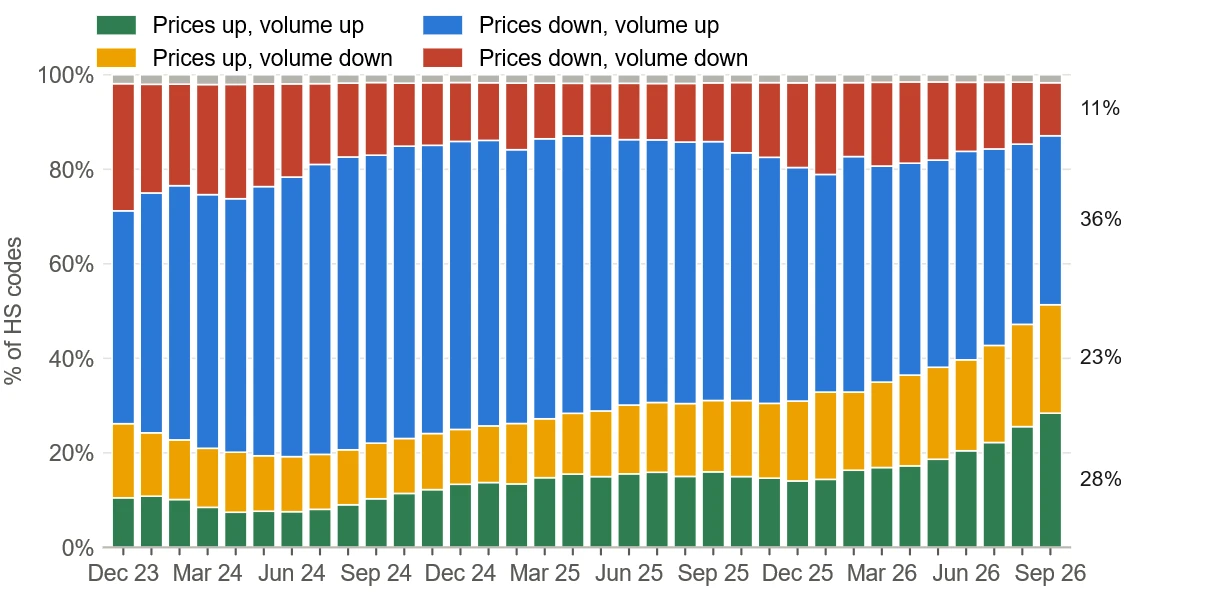
Share of the 4,241–4,256 HS codes exported in each period. Grey: codes that cannot be classified (exported in only one of the two periods, or without a standard-unit quantity).