Relative Trump Tariff Advantage Chart Book
This Chart Book illustrates the impact of the recent U.S. import tariff actions on relative market access conditions.
This Chart Book illustrates the impact of the recent U.S. import tariff actions on relative market access conditions.
Johannes Fritz
22 Dec 2025

Last update: 22 December 2025, 6 pm CET.
The recent headlines are dominated by discussions of a new 10% reciprocal tariff on U.S. imports. However, this is just the tip of the iceberg. The reality of the new U.S. tariff environment, effective as of August 2025, is a complex, multi-layered system that goes far beyond a single rate.
A Ride Down the U.S. Tariff Waterfall
To truly understand the impact on global trade, one must look at the full "waterfall" of tariff actions. This includes the baseline reciprocal tariff, but also crucial country-level exemptions (like for USMCA partners), sectoral tariffs under Section 232 on steel and aluminum, legacy Section 301 tariffs on Chinese goods, and other targeted executive orders affecting specific trade partners like Brazil.
To help navigate this complexity, the Global Trade Alert has released the "Relative Trump Tariff Advantage: Chart Book," a new analysis that calculates the final, trade-weighted effective tariff rates for every country and product exporting to the United States. For details on the underlying actions, please see our continuosly updating inventory of U.S. tariff measures.
We are making a full suite of resources available to help policymakers, researchers, and business leaders understand these critical policy shifts. All materials are available on our project page.
What You Can Find on This Page:
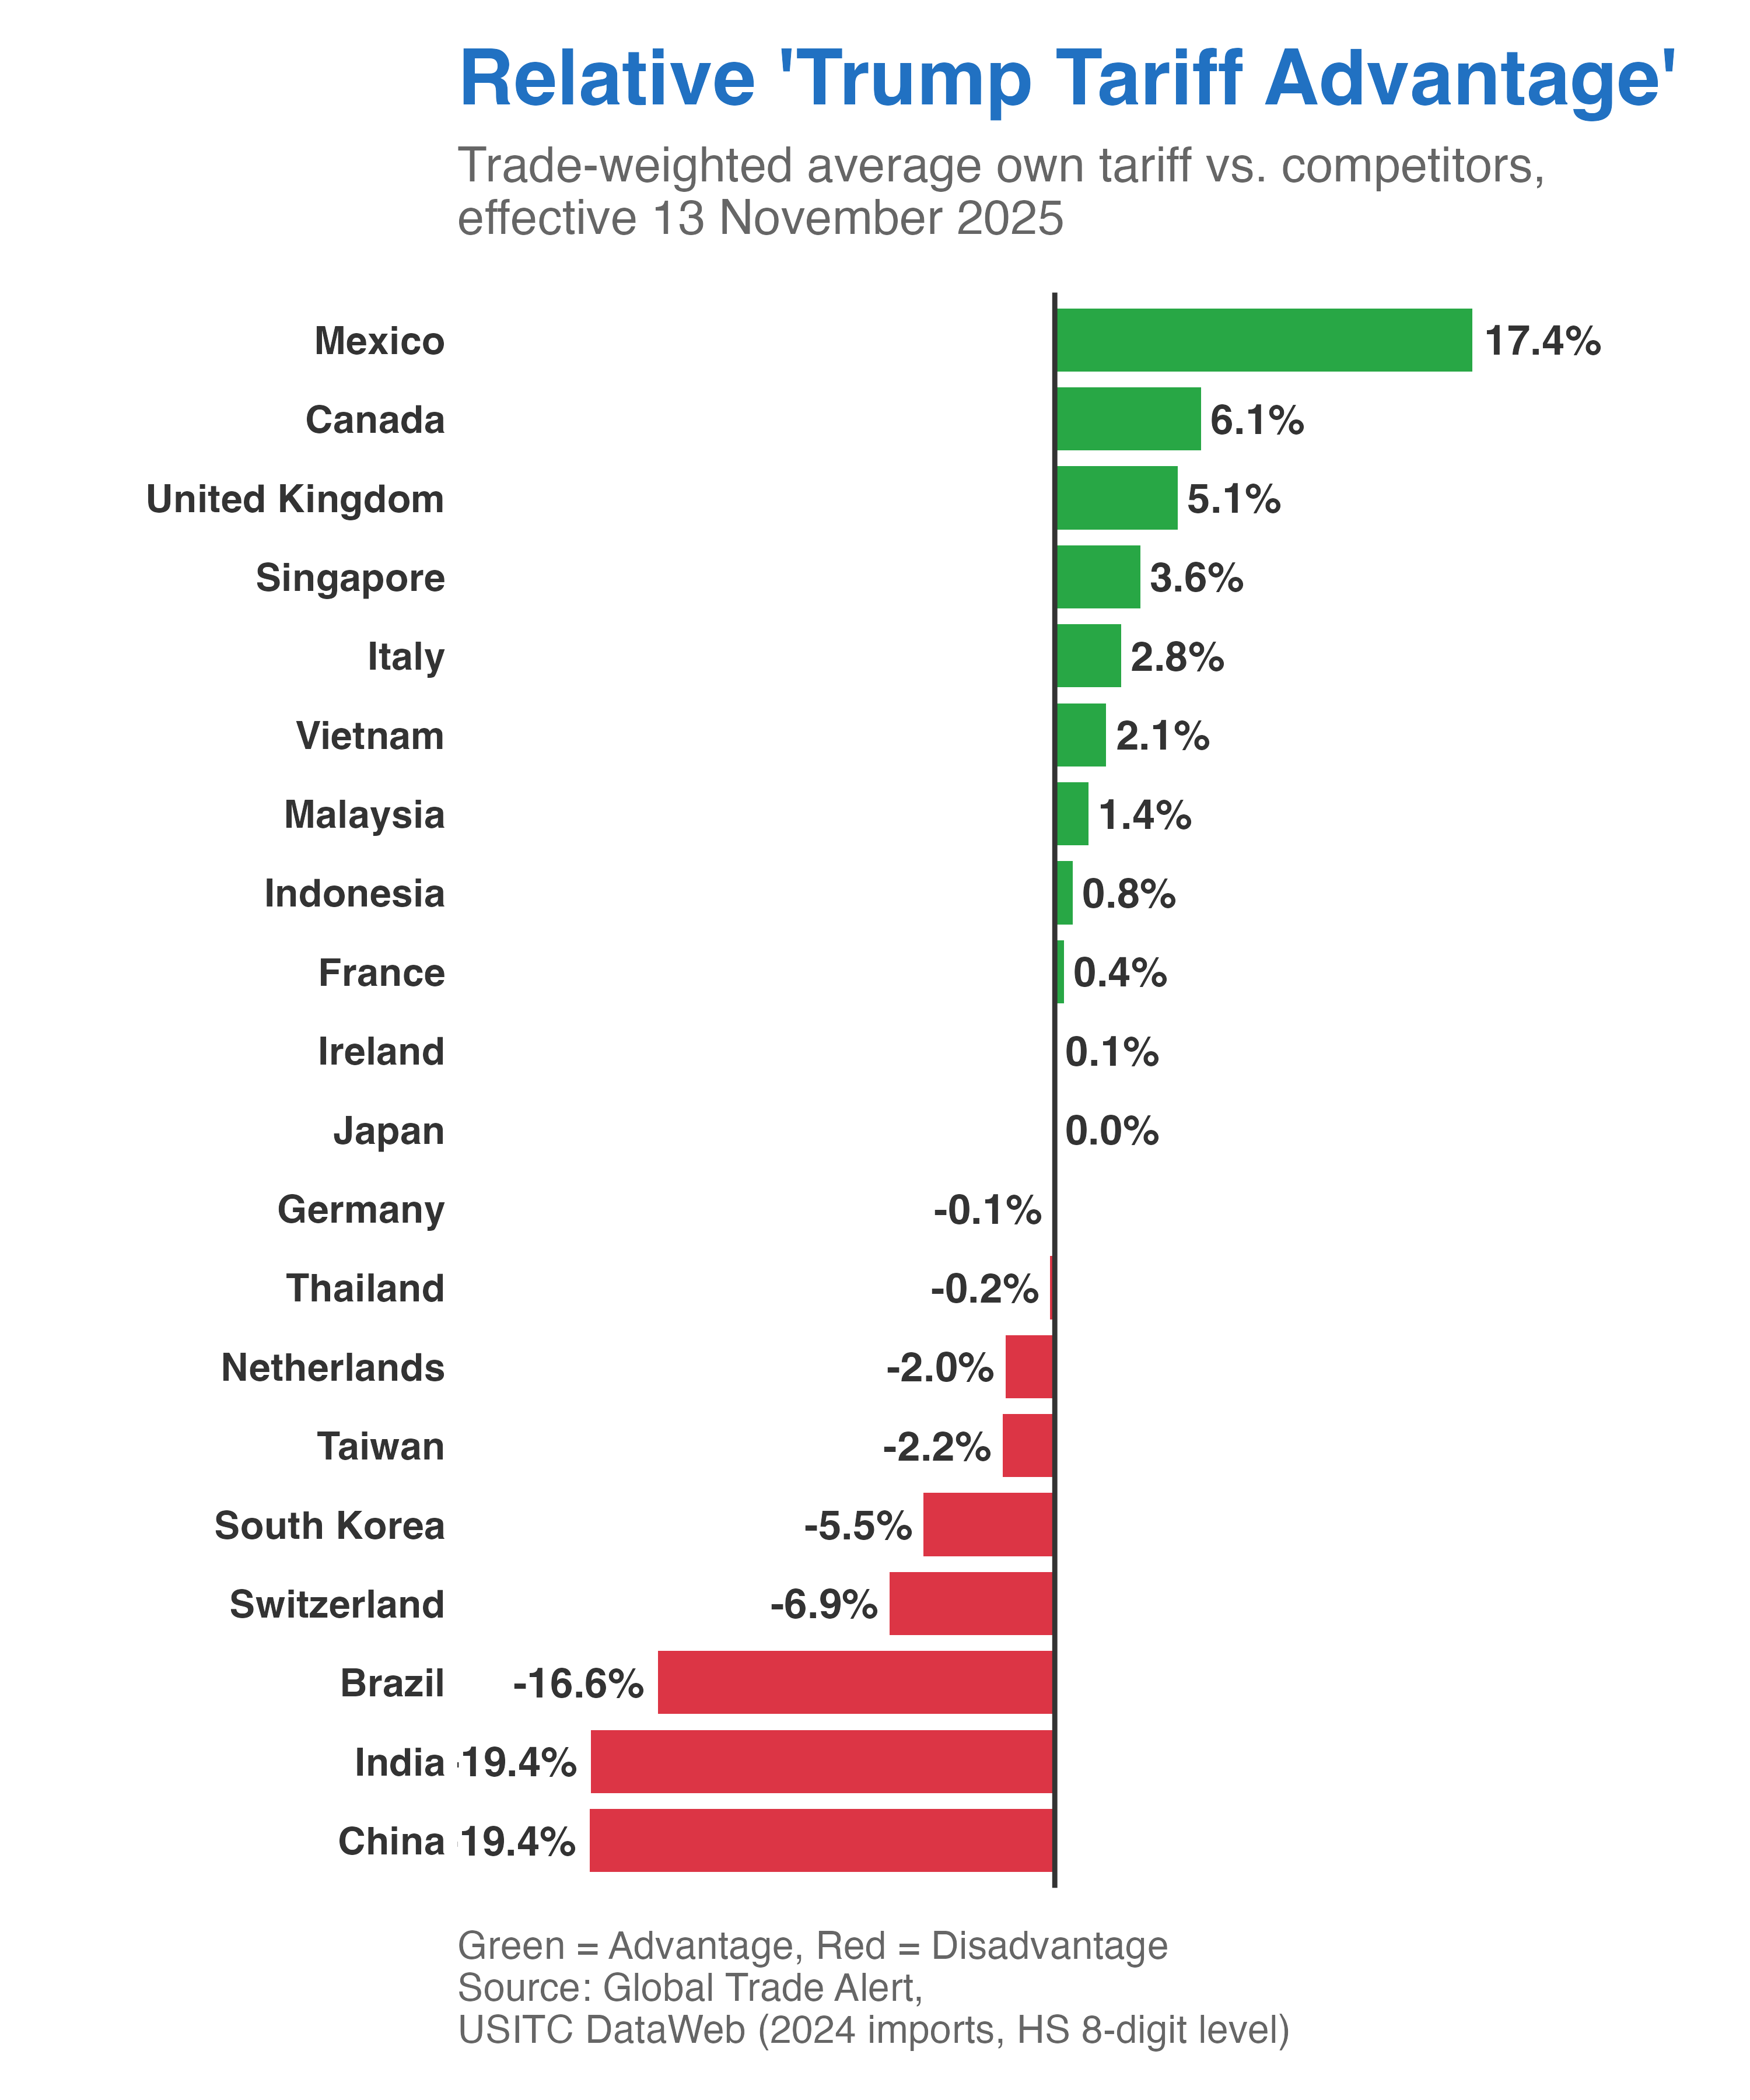
The Chart Book: A high-level PDF summary that illustrates the key findings. It’s perfect for understanding the top-line impacts, such as the effective tariff rates for the top 20 U.S. import origins and their resulting competitive standing.
Country Scorecards: The high-level statistisc about U.S. market access for each trading partner. Includes the headline rate, the effective rate after accounting for exceptions and Sec 232, etc., plus the relative competitive position and hypothetical tariff expenditures.
Complete Data & Charts Package: For those who need to go deeper, we have prepared a zip file containing the charts and underlying data for every import origin and HS 8-digit product.
Detailed Methodological Note: For full transparency, our methodological note explains, step-by-step, how we integrated the various tariff layers to calculate the final applied rates for each of the thousands of country-product combinations.
Full Replication Package: For complete academic and analytical rigor, we are also providing a separate zip file containing the R scripts and underlying data files our team used to generate the entire analysis. This allows anyone to reproduce our findings.
Our goal is to provide the clear, evidence-based tools needed to analyze a trade policy environment that is more complex than ever.