This note follows a single argument and shows how New Industrial Policy Observatory (NIPO) data can be put to work to support it. The argument is simple: each tightening of advanced-technology access by the United States and its Pax Silica partners lines up, in the data, with a fresh wave of Chinese state support for the same industries. The three figures that follow trace that pattern over time and across the coalition.
Authors
Fernando Martín Espejo
Date Published
18 Jun 2026
Related Topics:

In 1806, Napoleon closed the European mainland to British trade to strangle an enemy he could not invade. The Continental System slowed British exports and forced the continent to manufacture the textiles, sugar, and dyes it had been content to import. The blockade met its tactical target and engineered its strategic defeat (Heckscher, 1922).1 The advanced-technology controls now coordinated under Pax Silica, the U.S.-led coalition formed at the end of 2025, are a modern version of the same idea. The figures below use NIPO data to describe how that effort has played out, grouping measures by the countries that make up the coalition and tracking them back to 2017.
What Figure 1 Shows
Figure 1 places two NIPO series back to back over time. The upper area counts the restrictions the coalition has imposed on China; the lower area counts the subsidies China has put behind the same industries. Read together, the two move in step: each marked tightening of access is followed by a visible step up in Chinese state support. The chart does not prove that one causes the other, but it shows clearly that denial and subsidy have advanced on the same timeline.
Why the Pattern Matters
Chris Miller’s history of the chip industry shows that government demand, not the market alone, built the American semiconductor base in the first place (Miller, 2022).2 That is the pattern Figure 1 picks up again today: state money following state strategy. It is also why this looks different from the Soviet case, where similar ambitions failed for lack of a large home market and commercial pull. The point of the data is not to settle that debate but to make the timing visible, so the broader argument can be examined rather than asserted.
Where the Coalition Stands
The coalition has had real successes in restricting Chinese access, and in places it has shifted from blocking sales to taxing or taking stakes in them. But the effort is uneven. Measures get announced and then stalled or reversed, and the coalition’s members do not all pull in the same direction, with Europe in particular divided on how far to go. The restriction count in Figure 1 reflects a genuine but inconsistent campaign.
What Figures 2 and 3 Show
The next two figures use the same NIPO data to show a second pattern. Figure 2 plots each coalition member’s subsidies for advanced technology against its subsidies for critical minerals, split into three time periods. The dots cluster more tightly along the trend line as time goes on, meaning the countries spending on chips are increasingly the same ones spending on the minerals that feed them. Figure 3 repeats the exercise using export restrictions in place of subsidies and finds the same tightening link. Taken together, the two charts describe a coalition that is treating minerals and technology as one connected effort rather than two separate ones.
Reading the Slopes
Each panel in Figures 2 and 3 carries a single ordinary-least-squares slope, fitted on one dot per coalition member per year. The slope is the average number of additional critical-mineral subsidies associated with one more unit on the horizontal axis: advanced-technology subsidies in Figure 2, advanced-technology export restrictions in Figure 3.
Both relationships steepen across the three periods, and that is the substantive point the figures make visible. In Figure 2 the slope roughly triples, from 0.15 in 2017–19 to 0.51 in 2025–26: early in the window an extra advanced-technology subsidy came with only a small fraction of a critical-mineral subsidy, whereas by 2025–26 the two move closer to one-for-one. The coalition is increasingly funding chips and the minerals that feed them in the same hand. Figure 3 is the sharper shift. The 2017–19 slope is essentially zero, meaning export restrictions and mineral subsidies were unrelated at the start, consistent with restrictions being rare in those years. It then jumps to 1.20 in 2020–24 and 1.40 in 2025–26, so that by the later periods each additional export restriction is associated with more than one additional critical-mineral subsidy. The members doing the most to deny technology are also, and increasingly, the members building the upstream supply chains. Two cautions belong with these numbers. The slopes are bivariate and unadjusted, with no controls and no reported uncertainty, so they describe association rather than cause; and the 2025–26 panel rests on the fewest observations and partial-year data, which should temper how much weight its steeper slope is asked to bear.
Napoleon’s blockade ended up building the very industries it was meant to starve, and the coalition’s controls show signs of the same dynamic. The value of the NIPO data here is that it lets this argument be checked rather than simply asserted: the timing in Figure 1 and the tightening links in Figures 2 and 3 are all drawn from the same source and can be traced, period by period, by anyone who wants to look. That is the practical application of the dataset for this kind of analysis.
Fernando Martín is Head of Analytics at Global Trade Alert.
Figure 1. Action and reaction: each tightening of access is met by a Chinese subsidy response
Cumulative counts, 2017–May 2026. Restrictions build upward, subsidies build downward. The two sides use independent scales (labelled with true counts); the mirror is a reading device, not a one-to-one equivalence.
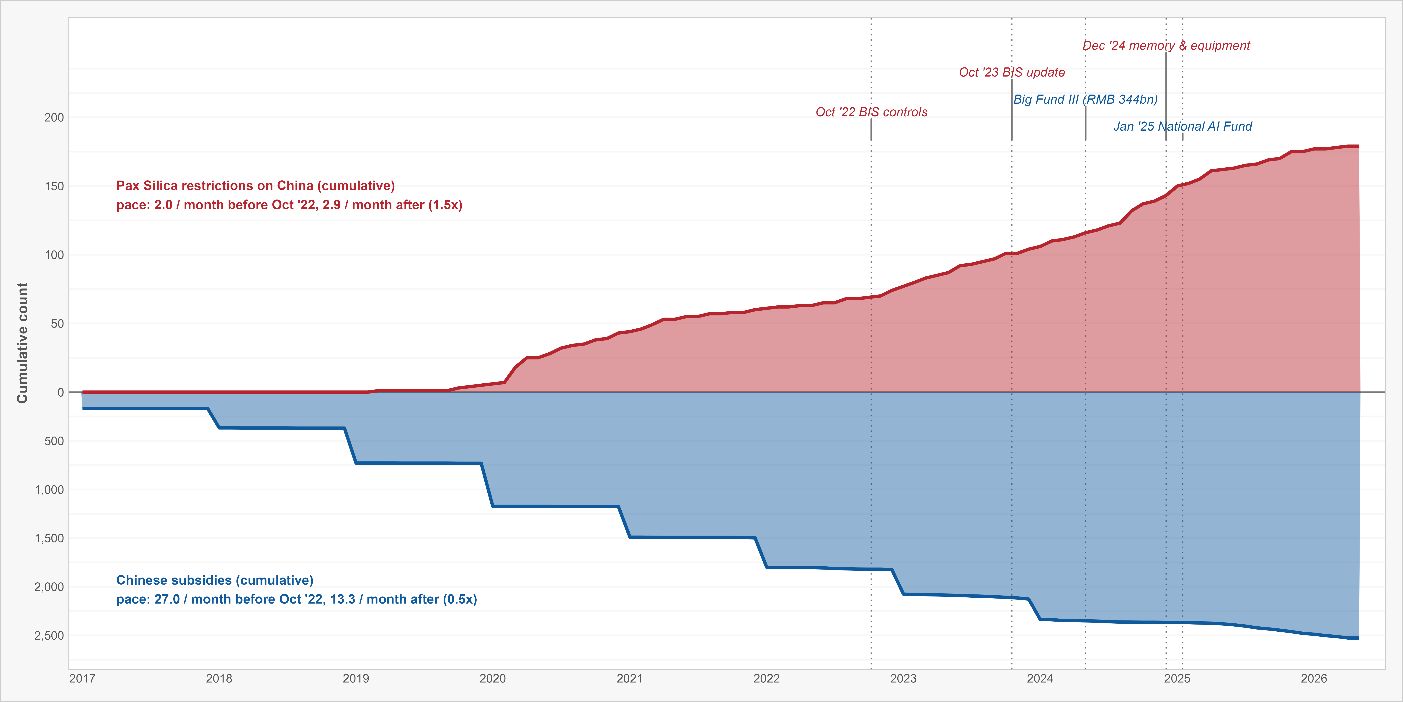
Source: New Industrial Policy Observatory (June 2026). Pax Silica members (signatories as of 16 Apr 2026): USA, Australia, India, Israel, Japan, Philippines, Qatar, Republic of Korea, Singapore, Sweden, UAE, United Kingdom; EU an observer (accession reported imminent, 1 Jun 2026). Sides use independent scales (true counts labelled). Many measures carry year-level precision (recorded as 1 Jan); cumulative counts are unaffected.
Figure 2. Pax Silica members increasingly couple advanced technology and critical mineral subsidies: the pairing is deepening
One panel per period. One dot per (country, year). Red line is the OLS fit; dashed line is 45°.
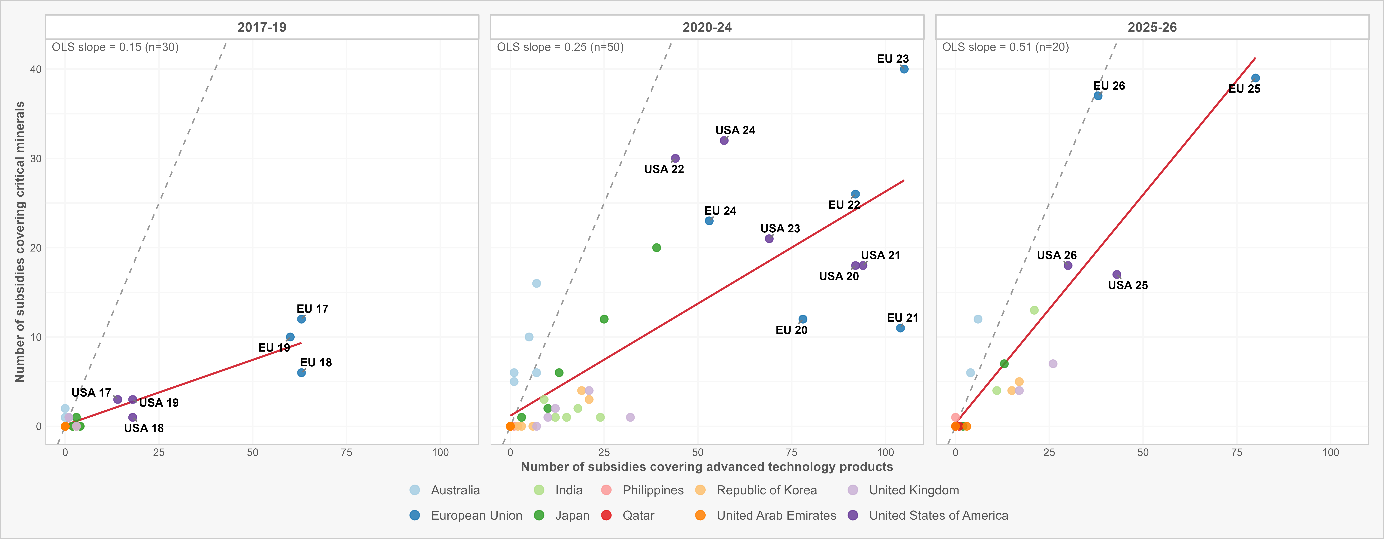
Source: New Industrial Policy Observatory (June 2026). Axes shared across panels; labels shown only for USA and EU. The 2025–26 panel covers partial data through 28 May 2026.
Figure 3. Pax Silica members that restrict technology exports are also those building critical mineral supply chains: a link growing stronger over time
One panel per period. One dot per (country, year). Red line is the OLS fit.
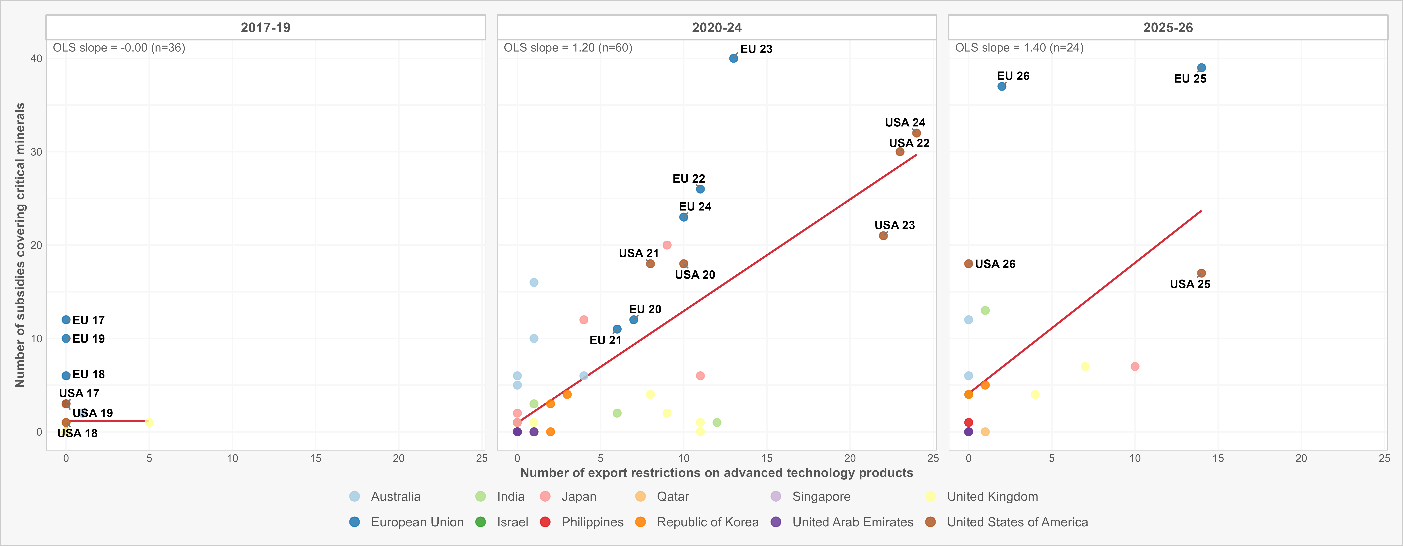
Source: New Industrial Policy Observatory (June 2026). Axes shared across panels; labels shown only for USA and EU. The 2025–26 panel covers partial data through 28 May 2026. Export restrictions target any jurisdiction; no 45° line, as the axes measure different instruments.
1
Heckscher, E. F. (1922). The Continental System: An Economic Interpretation. Oxford: Clarendon Press. (Harald Westergaard, ed.; published for the Carnegie Endowment for International Peace.)
2
Miller, C. (2022). Chip War. Scribner.