Diagnosing America's Enduring Manufacturing Jobs Problem: Fourteen Facts Any Serious Policy Programme Must Face
ZEITGEIST SERIES BRIEFING #99


ZEITGEIST SERIES BRIEFING #99
Simon Evenett
13 Aug 2026
National political debates necessarily simplify. Political leaders seeking to win over millions of voters cannot qualify every argument, distinguish every mechanism or rehearse every piece of evidence. Short explanations, memorable examples and clear prescriptions are part of effective political communication. There is nothing surprising about the decline of American manufacturing employment being presented in this way.
But simplification in communication should not become simplification in diagnosis. Policymakers deciding how to strengthen American manufacturing need to understand how much manufacturing employment declined, why the decline occurred when and where it did, why some places recovered and others did not, and which forces operated nationally, regionally or within individual states and industries. A policy built upon a poor understanding of the factual record may be easy to communicate yet poorly matched to the problem it is supposed to fix.
This distinction also matters because causes and possible responses implicate different levels of government in the United States. Trade policy is a federal responsibility. Workforce development, infrastructure and many aspects of the business environment depend heavily on state and local governments. Manufacturing production systems can span several states, meaning that what one state can accomplish may depend partly on the capabilities, infrastructure and investment decisions of its neighbours. The appropriate policy response therefore depends not only on identifying the right driver but also the right jurisdictional level.
I pay particular attention to the so-called Rust Belt states because manufacturing decline has unusual political salience there. Manufacturing has long played an important economic and social role in these states, and perceptions among voters and communities that their states have fallen behind have repeatedly shaped national political debate. Understanding the Rust Belt is therefore important both economically and politically. But the Rust Belt should not be confused with American manufacturing as a whole. Even in 1990, the ten states examined here accounted for only 37.1 per cent of U.S. manufacturing employment; almost 63 per cent was located elsewhere. By 2025 the Rust Belt share had fallen to 34.1 per cent.
For this study, the ten Rust Belt states are taken to be Iowa, Illinois, Indiana, Michigan, Missouri, New York, Ohio, Pennsylvania, Wisconsin and West Virginia. When I refer to the Rest of the United States, I mean manufacturing employment outside those ten states. This definition is deliberately broad enough to capture the principal northern industrial states while allowing me to examine whether apparently similar manufacturing economies actually followed similar paths.
I begin the detailed state comparison in 1990 for a substantive reason as well as on the grounds of data availability.[1] It is the first full calendar year after the fall of the Berlin Wall in November 1989 and provides a convenient marker for the beginning of the latest major phase of globalisation. This does not imply that globalisation began precisely in 1990, nor that developments after 1990 caused the manufacturing decline.
The purpose of identifying the stylised facts about U.S. manufacturing employment is not to select a preferred explanation in advance. It is to establish what any comprehensive explanation of U.S. manufacturing-employment decline must be able to account for. To that end, three easy-to-remember tests are proposed later in this paper. Establishing stylised facts, proposing tests for identifying weak policy diagnoses, and assessing their relevance to factors said to influence the fortunes of American manufacturing are far from being an intellectual exercise—they are central to good policy design, assessment and choice.
Policy-relevant research often focuses on quantifying the effects of certain possible causes on a relatively narrow set of outcomes. The artfully constructed “China Shock” literature is a case in point. This literature purports to show that Chinese imports are an important cause of employment loss in certain U.S. locales and largely focuses on the years until 2007, thereby setting aside subsequent macroeconomic and other developments (discussed below). The limited scope of that research programme has not stopped its use in political communication and in partisan analyst writing.
Establishing stylised facts serves a different purpose than narrowly tailored academic research: it helps decision-makers keep the bigger picture in view (looking across both geography and time) and widens the set of potential causes for America’s track record on manufacturing jobs.
The first four facts establish the broad chronology: When did U.S. manufacturing employment decline? Was the decline continuous? Did the Rust Belt simply follow the national pattern, or did it perform differently? And was any additional Rust Belt divergence enduring?
Post-war national jobs data make clear that American manufacturing employment was not always declining. Manufacturing employment rose substantially during the post-war decades. On an annual-average basis, it increased from about 14.0 million jobs in 1950 to 18.6 million by 1969. Employment then fluctuated at a high level through the 1970s before reaching the highest annual average in the post-war series.
U.S. manufacturing employment peaked at approximately 19.4 million jobs in 1979. By 1990 it had already fallen to 17.7 million—a loss of about 1.7 million jobs, or 8.9 per cent, before the post-Cold War globalisation era (the starting point for my detailed analysis).
The decline since the peak has been much larger. Manufacturing employment averaged about 12.6 million in 2025 and about 12.6 million during the first seven months of 2026. U.S. manufacturing employment is therefore currently roughly 6.8 million jobs, or 35 per cent, below its 1979 peak.
Any comprehensive explanation must therefore account for both the pre-1990 decline and what happened afterwards.
The post-1990 trajectory was far from a continuous decline. U.S. manufacturing employment fell only 2.4 per cent between 1990 and 2000, plunged 33.3 per cent between 2000 and 2010, rose 11.0 per cent between 2010 and 2019, and then edged down 1.1 per cent between 2019 and 2025.
The 2000s were therefore a stand-out decade of manufacturing job loss. The following decade produced a partial reversal: manufacturing employment increased for almost ten years. This turning point matters for diagnosis (see Figure 1). Any explanation based on a force that moved steadily in one direction must explain why manufacturing employment first fell sharply and then recovered while that force was still at work.
The Rust Belt experienced an additional deterioration beyond the national decline. Between 1990 and 2025, manufacturing employment fell about 34.4 per cent across the ten Rust Belt states, compared with about 25.2 per cent in the Rest of the United States. The Rust Belt's share of U.S. manufacturing employment fell from 37.1 per cent to 34.1 per cent.
There is therefore genuine regional underperformance requiring explanation. Yet manufacturing employment in the two parts of the country moved closely together. The correlation between year-on-year manufacturing-employment growth in the Rust Belt and the Rest of the United States was about 0.93. A correlation of one would indicate that the two moved perfectly together. Much short-run movement in Rust Belt manufacturing employment may reflect the national manufacturing cycle.
The additional Rust Belt deterioration was itself concentrated in particular periods. Between late 2003 and late 2007, the Rust Belt lost about 3.8 per cent of its manufacturing-employment position relative to the Rest of the United States. From May 2022 to June 2026, it lost another roughly 3.9 per cent.
By comparison, from mid-2011 to early 2020 the Rust Belt lost only about 2.2 per cent relative to the Rest of the United States over more than eight years. The relative decline was therefore episodic: concentrated in distinct periods rather than proceeding at a constant rate. An explanation must account not only for why the Rust Belt lost ground, but also for why the pace of that deterioration accelerated and slowed over time.
The long-run numbers reveal how many manufacturing jobs were lost. They do not reveal when those jobs disappeared or what happened afterwards. The next five facts distinguish job losses during recessions from the capacity of manufacturing employment to recover during subsequent expansions.
Recessions account for an exceptionally large share of the decline in manufacturing employment. Across the ten Rust Belt states, manufacturing employment fell cumulatively by about 2.36 million jobs during recession months between 1990 and 2025. Outside recession months, manufacturing employment rose by about 100,000 jobs. The eventual net decline was about 2.25 million jobs.
Cumulative recession losses therefore exceed the final decline because some manufacturing jobs were subsequently recreated. Manufacturing decline is not simply a slow process of jobs disappearing year after year. A large amount of employment disappears during relatively short economic contractions, making the strength and character of the subsequent expansion central to the eventual long-run outcome.
Recovery has many dimensions. A state can recover quickly after a recession without regaining its previous manufacturing-employment peak. It can remain below that peak while nevertheless recovering relative to manufacturing elsewhere in the United States. It can also improve relative to U.S. manufacturing while continuing to lose ground compared with non-manufacturing employment in its own economy.
After the Great Recession, only Michigan and Indiana regained their December 2007 manufacturing-employment levels before the next recession began in 2020. Yet the Rust Belt recovered most of the manufacturing ground it had lost relative to the Rest of the United States during the Great Recession. Four years after the recession ended, however, manufacturing employment across the ten states stood at only about 88 per cent of its pre-recession position relative to non-manufacturing employment in those same states. Claims about manufacturing “recovery” therefore need to state clearly what benchmark is being used.
The extent of manufacturing job loss during recessions does not determine the strength of the subsequent recovery. Across the four recessions, manufacturing employment in Michigan fell by an average of almost 12 percentage points more than Michigan's non-manufacturing employment. The equivalent figure for Indiana was about 8.7 percentage points—the second largest among the ten states.
Yet both states subsequently recovered comparatively strongly. Four years after the Great Recession, manufacturing employment relative to non-manufacturing employment had recovered to about 94 per cent of its pre-recession position in Michigan and 90 per cent in Indiana, compared with about 80 per cent in New York and 85 per cent in Pennsylvania. Exposure to national recessions and a state's capacity to rebuild manufacturing employment are therefore distinct features of a state's manufacturing economy.
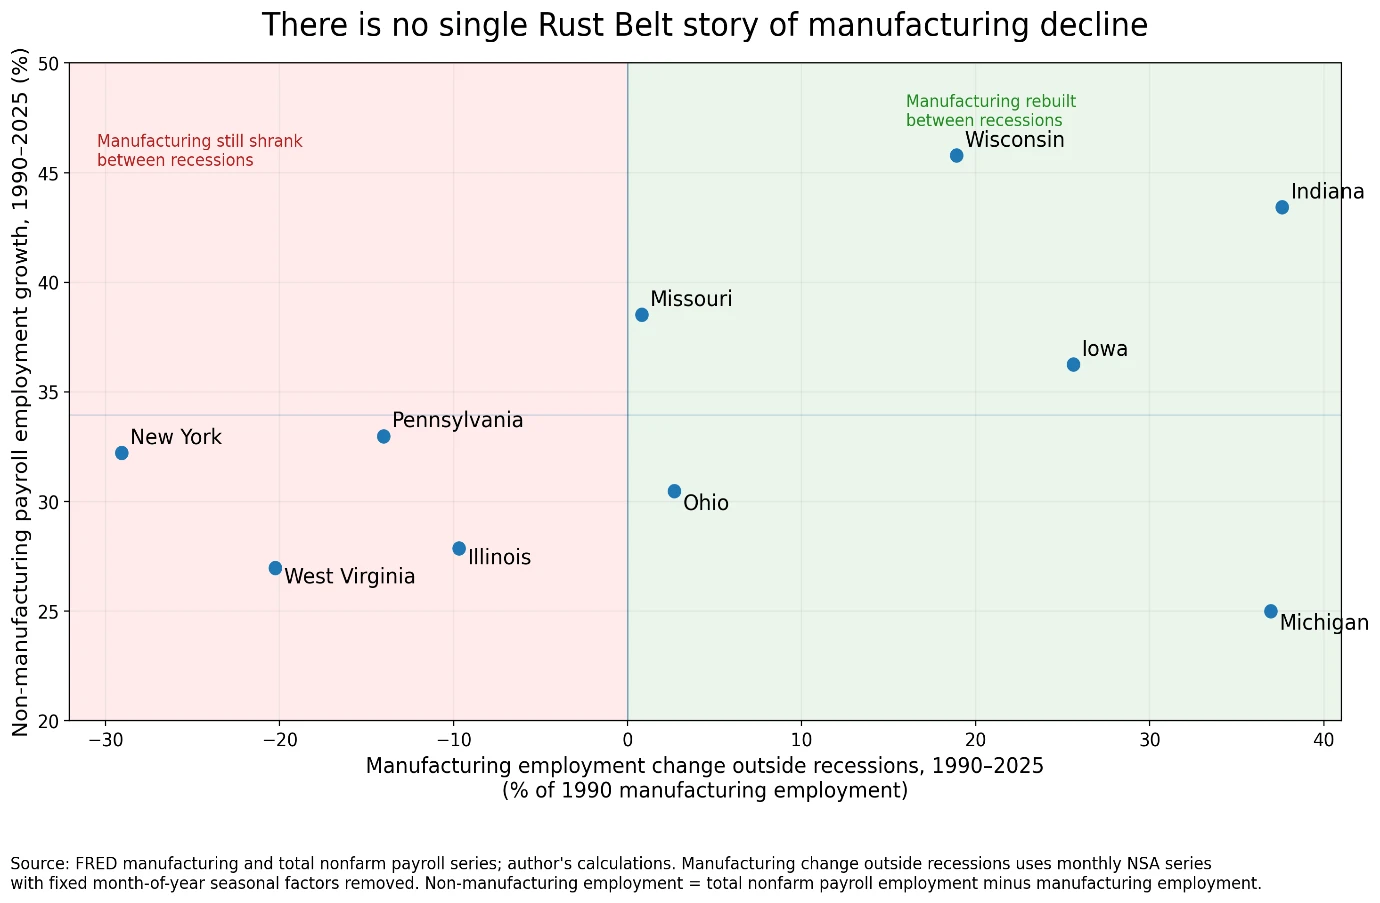
The experience outside recessions differs sharply across states. Between 1990 and 2025, manufacturing employment in Michigan increased cumulatively by about 307,000 jobs outside recessions, while Indiana added about 228,000. During the same non-recession months, New York lost about 286,000 manufacturing jobs and Pennsylvania lost about 134,000.
Manufacturing employment also increased outside recessions in Iowa, Ohio and Wisconsin. It continued to fall in Illinois and West Virginia, while Missouri was essentially flat. There are different patterns of manufacturing job decline. In some states, the central problem is a large recession loss followed by incomplete reversal. In others, manufacturing employment continues to decline during years when the wider state economy is expanding.
There is an important distinction between absolute job loss and relative decline. In absolute terms, most manufacturing-employment losses occurred during recessions. But the Rust Belt often recovered much of its recession-induced disadvantage against manufacturing elsewhere during the first years of the subsequent expansion.
Across the four recessions since 1990, the Rust Belt's manufacturing-employment position relative to the Rest of the United States deteriorated substantially during recessions. About nine-tenths of that recession-related relative deterioration was recovered during the first 24 months of the subsequent recoveries. Outside recessions and these early recovery periods, the Rust Belt lost a further roughly 11 per cent relative to the Rest of the United States.
A state can therefore add manufacturing jobs during an expansion and still fall behind if manufacturing elsewhere expands faster. Recessions do much of the immediate damage. The years that follow determine how much of that damage is repaired and whether a region subsequently keeps pace with the rest of the United States.
The Rust Belt aggregate conceals large differences between individual states. The final five facts examine those differences and place manufacturing employment in the context of the wider state economy.
There is no single state-level Rust Belt experience (see Figure 2). Between 1990 and 2025, manufacturing employment in Iowa declined by only 1.3 per cent. Meanwhile, manufacturing employment in New York fell by 58.8 per cent.
By 2025, Iowa retained almost 99 per cent of its 1990 manufacturing-employment level, while New York retained only about 41 per cent. Indiana and Wisconsin retained more than 85 per cent; Pennsylvania and West Virginia retained less than 60 per cent. States also differ in their exposure to national manufacturing conditions, recession sensitivity, recovery capacity and longer-term manufacturing performance. The geographical variation is therefore too great for the Rust Belt to be treated as one homogeneous manufacturing economy.
One possibility is that manufacturing declined simply because particular state economies were generally weak. The data do not support such a simple interpretation. I estimated manufacturing-employment growth after taking account of manufacturing conditions elsewhere in the United States, recessions and recoveries, and employment growth in the non-manufacturing part of each state's own economy.
Even after these influences are taken into account, seven states—Illinois, Indiana, Michigan, New York, Ohio, Pennsylvania and West Virginia—show a statistically significant underlying decline in manufacturing employment. Across the ten states, the estimated underlying manufacturing trend becomes more negative once employment growth in the wider state economy is taken into account. Manufacturing in these states therefore underperformed not only manufacturing elsewhere but also the rest of their own state's labour market.
Once national manufacturing conditions and wider state employment movements are taken into account, the common relationship across all ten Rust Belt states becomes much weaker. But a narrower geographical pattern survives.
Manufacturing employment in Michigan, Indiana and Ohio continues to move strongly together even after national manufacturing conditions, recession and recovery effects, and each state's non-manufacturing employment have been taken into account. The remaining correlations are about 0.71 between Indiana and Ohio, 0.68 between Michigan and Ohio, and 0.65 between Michigan and Indiana.
These figures do not identify the cause. They do, however, point towards a manufacturing system that crosses state borders. Automotive production, supplier networks, shared industrial structure or other regional production links are obvious hypotheses to investigate. This matters for policy as well: if a manufacturing system operates across several states, what one state can accomplish may depend partly on investment, infrastructure and industrial capabilities in neighbouring states.
Manufacturing declined not only relative to manufacturing elsewhere but also relative to other employment within the same states. Between 1990 and 2025, the ten states lost about 2.25 million manufacturing jobs while adding almost 9.8 million non-manufacturing payroll jobs. Manufacturing's share of total payroll employment fell from about 18.0 per cent to 9.8 per cent.
Every one of the ten states became less manufacturing-intensive. Even Iowa, Wisconsin and Indiana—states that preserved manufacturing employment comparatively well—experienced substantial growth in non-manufacturing employment relative to manufacturing. Deindustrialisation in these states therefore involved a major change in the composition of employment, not simply an inability to create jobs.
The economic environment surrounding manufacturing decline also varied greatly. Between 1990 and 2025, non-manufacturing payroll employment grew about 45.8 per cent in Wisconsin and 43.4 per cent in Indiana, compared with 25.0 per cent in Michigan and 27.0 per cent in West Virginia. Across all ten states, about 4.3 non-manufacturing payroll jobs were created for every manufacturing job lost.
That ratio is an accounting comparison. It does not imply that workers displaced from manufacturing personally moved into those new jobs. The different combinations nevertheless matter. New York combined an exceptional manufacturing-employment decline with substantial employment creation elsewhere. Michigan experienced sizeable manufacturing losses alongside the weakest percentage increase in non-manufacturing employment among the ten states. Manufacturing-employment decline and weak overall job creation are potentially different policy problems.
Taken together, these fourteen facts suggest three tests that any convincing explanation of U.S. manufacturing-employment decline would need to pass.
An explanation must account for the timing of the national decline: losses before 1990, relatively little change during the 1990s, accelerated job loss in the 2000s, partial recovery during the 2010s and renewed weakness thereafter. It must also account for the timing of the additional Rust Belt decline, which was concentrated in particular periods rather than proceeding steadily.
The central question is therefore not simply whether a particular driver could reduce manufacturing employment. It is: can that driver explain when manufacturing employment fell, when it stabilised and when it recovered? A driver that moved persistently in one direction faces an especially demanding test given that U.S. manufacturing employment totals have changed direction.
An explanation must account for why so many manufacturing jobs disappear during recessions and why the subsequent restoration of those jobs differs so much across states and across downturns. This probably requires distinguishing the initial hit from what happens during the expansion that follows.
The question is: can the explanation account both for manufacturing job losses during downturns and for the very different capacities of states to rebuild manufacturing employment afterwards? This test directs attention not only towards the source of a downturn but also towards demand, investment, plant survival, establishment formation, financing conditions, durable-goods purchases and the ability of manufacturing firms in general to expand when the national economy recovers.
An explanation must also account for where manufacturing employment declined. Why did Iowa retain almost all of its 1990 manufacturing employment while New York lost nearly 60 per cent? Why does manufacturing employment in Michigan, Indiana and Ohio continue to move together after broader economic forces are removed? Why did every Rust Belt state become less manufacturing-intensive while non-manufacturing job creation differed so greatly across states?
The question is: can the explanation account for the geography of manufacturing decline and for the different economic environments in which that decline occurred? This matters particularly because causes and possible responses can operate at the federal, state, local, interstate or regional levels.
These three tests provide a useful lens to assess familiar explanations of U.S. manufacturing-employment decline. The tests are at their most revealing when applied to trade, because the major trade shocks come with dates attached—NAFTA in 1994, WTO accession and PNTR in 2000–01, the Made in China 2025 industrial policy programme in 2015 etc. That lets the timing test be applied with unusual precision and, as will become clear, combined with the recession test. Any China-based account must also explain the clustering of losses in downturns and the larger losses in more exposed states and industries.
Trade-related explanations initially fare reasonably well on parts of the timing test, but the chronology is less promising than it first appears. NAFTA entered into force in 1994. An explanation centred on NAFTA must confront the relatively modest aggregate decline in U.S. manufacturing employment during most of the 1990s.
The United States enacted Permanent Normal Trade Relations with China in October 2000 and China joined the WTO in December 2001. The steep decline in U.S. manufacturing employment during the 2000s therefore makes changes in international competition an “obvious” candidate for investigation. But the decade contains more than one distinct episode of job loss.
Manufacturing employment fell sharply around the 2001 recession and, importantly, continued to decline for several years after that recession ended. The initial sharp fall is difficult to attribute to the threat of Chinese imports alone. It coincided with the bursting of the dot-com bubble and the recession that followed—a shock whose effects on business investment and technology-related manufacturing were considerable in their own right. That this shock arrived so close to China's WTO accession will bedevil attempts to separate the effects of each.
Perhaps the more telling feature is the persistence of the job decline after the dot-com-related recession ended: a purely cyclical account struggles to explain why U.S. manufacturing employment kept falling during the ensuing national economic recovery.
Substantial manufacturing job losses also occurred during the 2007–09 Global Financial Crisis. That severe recession provides an obvious alternative explanation for a large part of the manufacturing job loss recorded during the 2000s. The timing evidence therefore makes China and PNTR candidates for explaining part of the post-2001 acceleration in job loss, but it does cast doubt on attempts to treat the entire manufacturing decline of the 2000s as a single China-driven episode.
The appropriate question is consequently not whether China's WTO accession coincided with U.S. manufacturing job loss—it plainly did—but how much of the exceptional post-2000 deterioration can be attributed to that change rather than to recessions and other forces operating at the same time. The landmark papers in the China Shock literature claim to have found such evidence for the years up to 2007. Although these accounts acknowledge that U.S. manufacturing job loss was greater during the Global Financial Crisis, they cast Chinese imports, rather than the American macroeconomic cycle, as the villain.
China's signature industrial policy creates another timing test. China's State Council implemented Made in China 2025 in 2015 as a ten-year programme intended to upgrade the country's manufacturing capabilities. Yet U.S. manufacturing employment did not begin another major decline when that programme started. Between 2015 and 2019, U.S. manufacturing employment increased by about 3.8 per cent, while manufacturing employment across the ten Rust Belt states increased by about 2.4 per cent. This does not show that Made in China 2025 had no effect. Indeed, there could be a lagged effect on U.S. manufacturing employment. What is clear is that a simple account in which stronger Chinese industrial capabilities necessarily and immediately translate into fewer American manufacturing jobs is difficult to sustain.
More recently, a narrative about a China Shock 2.0 gained in salience. The contention is that Chinese exports have surged in recent years. In fact, Chinese exports worldwide rose by 13.7 per cent in U.S. dollar terms from 2021-2025, a rate slightly higher than the 9.7 per cent increase during 2015-2019.[2] The relevance of this narrative to the United States is questionable in light of the fact that Chinese exports to the United States were 26 per cent lower in 2025 than they were in 2021. That reduction in Chinese imports into the United States coincides with renewed weakness in U.S. manufacturing employment after 2022 and a sharper decline in the Rust Belt.
The timing evidence therefore cuts in different directions. The decline in U.S. manufacturing employment after the dot-com bust and before the Global Financial Crisis is potentially consistent with a role for China import exposure. The continuation of U.S. manufacturing-employment growth after the launch of Made in China 2025 presents a challenge to a simple monotonic version of that story. A further challenge has arisen in recent years when U.S. manufacturing job loss has occurred while Chinese imports into the United States have been falling. Given this factual record, I wonder whether an all-encompassing “China Shock” narrative is warranted.
Automation faces a different version of the timing test. Technological change can reduce the amount of labour needed to produce a given quantity of manufactured output. But if labour-saving technologies were adopted progressively over time, an automation-based explanation must account for why manufacturing-employment losses were so heavily concentrated in particular periods, especially the 2000s, and why employment subsequently increased for much of the 2010s.
Automation must also pass the geography test. Why did manufacturing employment in Iowa remain close to its 1990 level while New York lost nearly 60 per cent? Why were Michigan and Indiana unusually recession-sensitive? Why does a distinct Michigan–Indiana–Ohio relationship survive after broader conditions are removed? Automation may be an important reason why manufacturing output and manufacturing employment can diverge, but an all-encompassing automation explanation must reproduce the timing, cyclicality and geography of the observed employment changes rather than merely establish that labour-saving technology existed.
The stylised facts presented earlier suggest that the U.S. macroeconomic cycle should be treated as part of the phenomenon to be explained rather than merely as a statistical control. To be clear, available employment data do not establish that particular monetary or fiscal decisions caused manufacturing job losses. They do establish that booms, recessions and recoveries are central to the timing of manufacturing employment changes.
Most Rust Belt manufacturing job losses occurred during recessions. Yet those losses were sometimes followed by substantial rehiring. This means that a macroeconomic explanation cannot stop at the recession itself. The composition and strength of the subsequent expansion matter as well. Typically, manufacturing is particularly sensitive to changes in demand for durable goods, business investment, inventories and financing conditions. A downturn can reduce employment quickly; a strong recovery can restore much of it, while a weak or differently composed expansion may not.
The Great Recession and the 2010s illustrate the point. Manufacturing employment fell extremely sharply during the downturn and then increased substantially during the following decade. That sequence is difficult to describe as a purely secular decline. It suggests an interaction between longer-run structural forces and the U.S. business cycle: structural vulnerabilities may determine which jobs are at risk, while recessions can determine when large losses actually occur and expansions determine how many of those jobs return.
COVID provides a sharp stress test. The ensuing macroeconomic shock was sudden, national and extremely large, but manufacturing employment subsequently returned quickly to pre-pandemic levels in some places and much more slowly in others. At the national level, U.S. manufacturing employment regained its pre-COVID level roughly two years after the April 2020 trough. Among the ten states, Indiana, Missouri and Wisconsin regained their February 2020 manufacturing-employment levels about 22 months after the trough; New York, Ohio and Pennsylvania had still not regained those levels by June 2026.
That variation is revealing. A common national shock did not produce a common recovery path. Such evidence suggests that the macroeconomic cycle could have interacted with industrial composition, establishment survival, investment behaviour and state or regional conditions. In turn, this raises the policy question of what factors determine whether a manufacturing cluster or sector can rebuild rapidly when aggregate demand returns.
Some manufacturing jobs may have moved from the Rust Belt to other parts of the United States rather than being lost from America altogether. A domestic-relocation explanation therefore needs to identify where activity moved and why.
The comparison with manufacturing employment in the Rest of the United States is central here. The Rust Belt lost substantially more manufacturing employment than the rest of the country, and much of its long-run relative decline occurred outside recessions and their immediate aftermath. That pattern is at least compatible with a gradual geographical reallocation of activity within the United States. But compatibility is not evidence of causation. A serious relocation explanation must identify destination states, industries, plant openings and investment flows and establish whether those gains correspond to losses in the Rust Belt.
The corresponding policy implications would differ fundamentally from those associated with foreign competition. Tariffs may affect whether production takes place in the United States; they do not determine whether a new American plant is built in Ohio, Tennessee, Texas or South Carolina.
State policies, workforce institutions, taxation, regulation, infrastructure, land availability, permitting, business costs and historical labour-management relationships are plausible candidates for explaining why state outcomes differ. They fit more naturally with the geography test and with the finding that manufacturing employment in several states continued to underperform even after conditions in the wider state economy were taken into account.
COVID strengthens the case for taking these differences seriously as hypotheses. The states were struck by a broadly common national shock, yet their manufacturing-employment recoveries differed markedly. Some regained their pre-COVID manufacturing levels within roughly two years; others had not done so more than six years after the trough. That does not prove that state policies caused the difference. Industry composition, firm mix and the size of the initial shock could also matter. But COVID provides a useful stress test of how effectively different state manufacturing systems restore employment after a sudden, non-trade-related disruption.
State explanations nevertheless face an important constraint. Short-run manufacturing movements remain strongly tied to national conditions. A state can improve its business environment but cannot insulate itself from a national recession or determine national interest rates, exchange rates or trade policy. Conversely, national policy cannot by itself determine whether a particular state possesses suitable industrial sites, skills, infrastructure or supplier networks. The evidence therefore points towards interaction rather than a choice between federal and state factors.
Industry composition, automotive and durable-goods exposure, supplier networks and establishment dynamics offer a potentially important bridge between the timing, recession and geography tests.
Industrial composition could explain why manufacturing employment in Michigan and Indiana is particularly sensitive to recessions. Establishment dynamics could explain why a temporary fall in demand becomes a permanent employment loss if plants close and are not subsequently replaced. Integrated production networks could help explain why manufacturing employment in Michigan, Indiana and Ohio continues to move together after national manufacturing conditions and wider state labour markets are taken into account.
These factors could also explain why the same national episode has different local consequences. A state dominated by industries with highly cyclical demand may experience a deep initial employment loss but recover rapidly if plants survive and demand returns. Another state may suffer a smaller initial decline but continue losing establishments during the expansion. Such possibilities fit the evidence, but they remain hypotheses until tested directly with industry, establishment, investment and production-network data.
The lasting value of this approach lies less in any verdict reached here than in the standard it sets. The fourteen stylised facts and the three tests give a durable, transparent yardstick against which competing explanations—and, more consequentially, the remedies built upon them—can be judged. One need not resolve the underlying debate to ask whether a diagnosis fits the timing of the losses, accounts for their concentration in recessions and recoveries, and explains their uneven geography. In a debate crowded with confident but partial narratives, a shared and memorable way of separating the plausible from the untenable is itself worth having.
The persistence of America's job loss problem should induce some humility. The Biden administration deployed substantial industrial subsidies and tax incentives through measures including the CHIPS and Science Act and the Inflation Reduction Act. The Trump administration subsequently raised tariffs sharply from 2025 onwards with the stated aim, among others, of encouraging firms to invest, manufacture and hire in the United States. Yet, on a seasonally adjusted basis, U.S. manufacturing employment stood at 12.6 million in July 2026, 14,000 below a year earlier. A renaissance in manufacturing employment has not occurred under either administration.
That makes disciplined diagnosis more, not less, important. The fourteen stylised facts recounted here suggest three tests for claims about both causes and remedies. Does an explanation or policy fit the timing and turning points in U.S. manufacturing employment? Can it account for the concentration of job losses in U.S. recessions and the very different recoveries that follow? And can it explain the geography of manufacturing decline—why states facing the same national economy have experienced such different outcomes? A policy that addresses only one of these dimensions may still be valuable, but its likely effect should not be overstated.
These tests provide a practical standard against which campaign narratives and subsequent policy initiatives can be judged. Policymakers can use them to distinguish the problems a proposed intervention can plausibly address from those it cannot. Journalists and analysts can use them to interrogate campaign promises and the policies that follow. Corporate executives can use them to judge whether announced policies are likely to alter the business conditions affecting investment and operational decisions. Political leaders applying these tests are less likely to fall into the trap of believing their own campaign slogans amount to a credible diagnosis of the woes of American manufacturing.
The perceived failure to revive manufacturing employment remains an enduring problem in American politics. Political communication will always simplify; the danger arises when that simplification carries over into diagnosis and policy prescription. The harder task is to identify which forces explain the timing, recovery and geography of manufacturing job loss, and then match policies to the problems they are actually capable of changing. Although the analysis here focuses on the United States, the same discipline should be useful wherever manufacturing job loss has acquired significant political salience.
Simon J. Evenett is Professor of Geopolitics & Strategy, IMD Business School, Lausanne, Switzerland; Co-Chair, Trade & Investment Council, World Economic Forum; Founder, St. Gallen Endowment for Prosperity Through Trade, the institutional home of the few remaining independent trackers of digital, trade, industrial, subsidy and investment policy.
Figure 1:
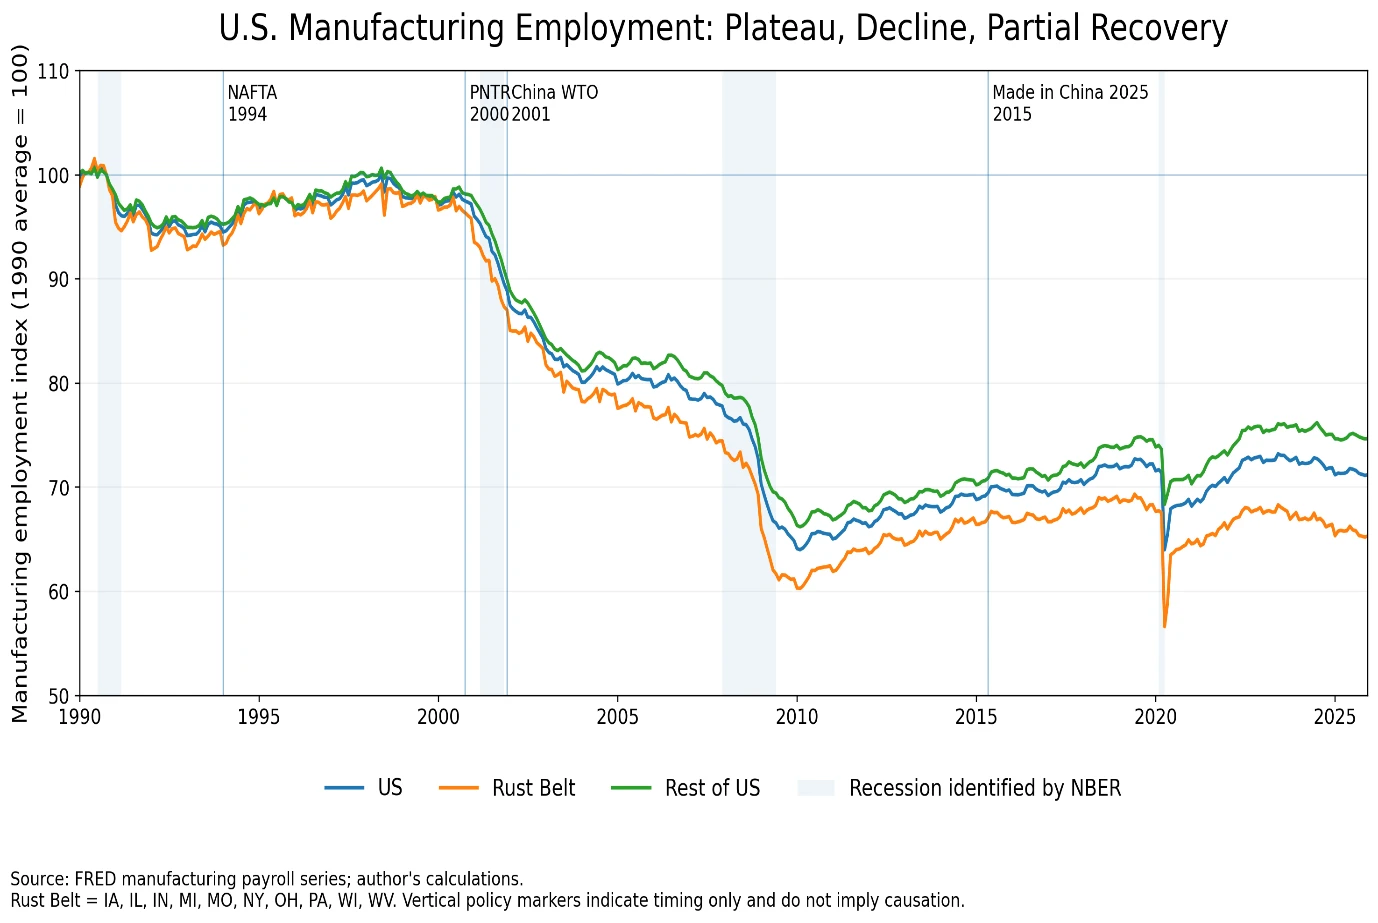
Figure 2:
All U.S. employment data used in the empirical analysis were sourced from the FRED macroeconomic database assembled by the St. Louis Fed.
The source of these data is Trade Data Monitor.