China's Manufactured Exports: How Much More, of What, to Whom, at What Price?
ZEITGEIST SERIES BRIEFING #102


ZEITGEIST SERIES BRIEFING #102
Simon Evenett
14 Sep 2026
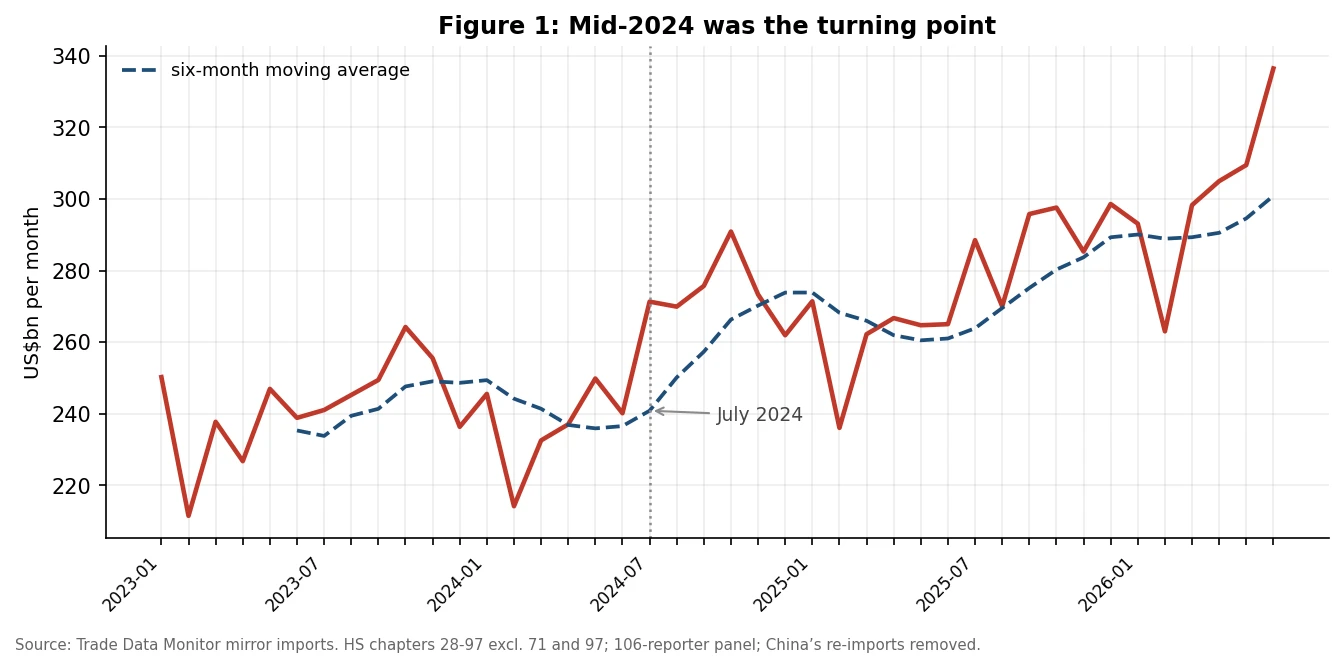
China’s monthly trade releases attract attention as concerns mount about job loss and deindustrialisation abroad. Using data through to the end of the first half of this year, this briefing asks how much China’s manufactured exports have grown since 2023.[1] My best apples-for-apples estimate, imports of manufactured goods from China rose from $1.41 trillion in H1 2023 to $1.81 trillion in H1 2026, an increase of $394 billion, or 27.9 per cent. Figure 1 shows the monthly path since January 2023.
Timing matters. Chinese manufactured exports were close to flat through the first half of 2024, then moved to a higher level around July 2024. They subsequently grew steadily. June 2026 was an unusually strong month: manufactured exports were 8.7 per cent higher than in May and 11.8 per cent above the 2026 monthly average. China’s export expansion also has a parallel in the rest of the world. Between H1 2023 and H1 2026, non-Chinese suppliers increased their manufactured exports by about 21 per cent, adding $1.33 trillion—more than three times China’s $394 billion increase.
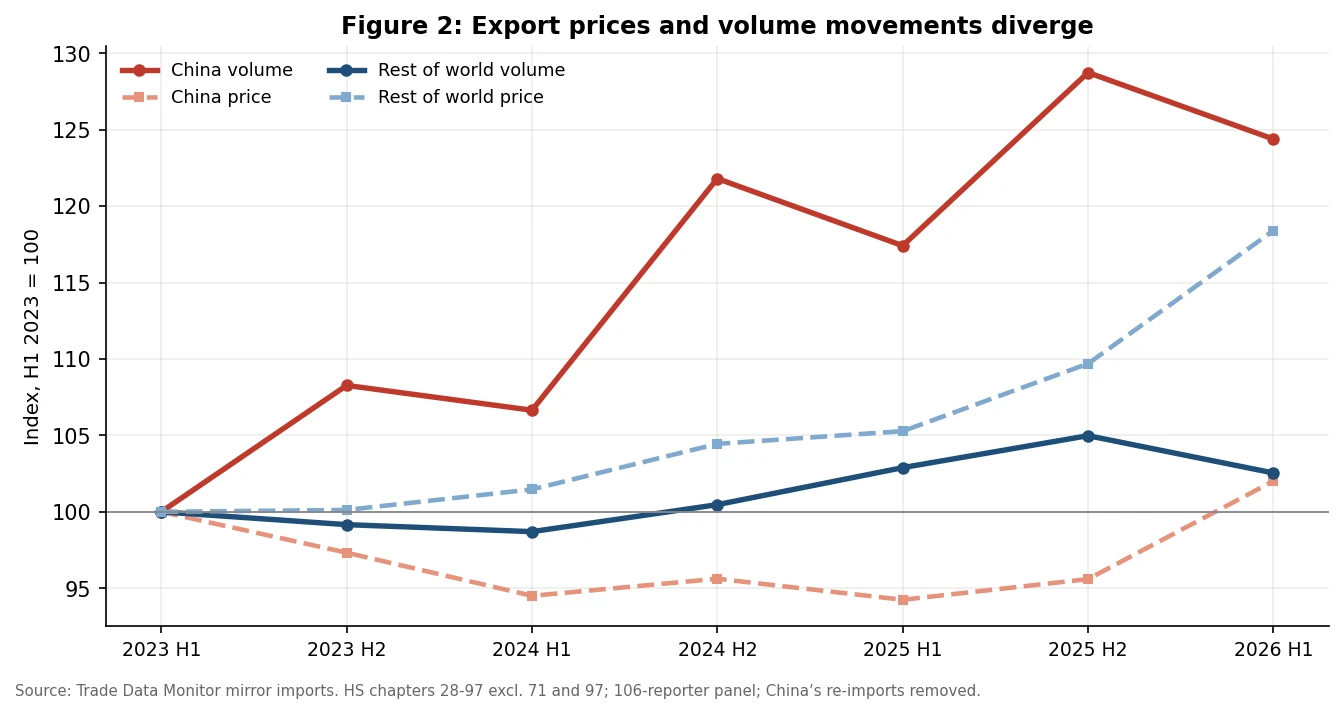
To separate changes in spending from changes in quantities shipped, I constructed Törnqvist price and volume indices specifically for manufactured goods. Economy-wide, China’s manufactured-export value index rose from 100 in H1 2023 to 126.9 in H1 2026. Its price index rose only to 102.0, implying a volume index of 124.4 during the first half of this year. The corresponding indices for non-Chinese suppliers were 120.6 for value, 117.4 for price and 102.7 for volume. Figure 2 shows the divergence. On this basis, China shipped about 24.4 per cent more manufactured goods, while non-Chinese suppliers shipped only 2.7 per cent more. Meanwhile, the latter saw their measured export prices rise nearly nine times as much.
Product-level evidence complicates sweeping narratives about Chinese dumping and flooding overseas markets. Memory integrated circuits were the largest contributor to China’s increase in manufactured-export value, adding $55.4 billion. Their value rose 322 per cent on the back of a 51 per cent increase in volume and price hikes of 175 per cent. In contrast, solar panels moved in the opposite direction: export value fell by about half, yet volume rose by 6 per cent while prices fell by 53 per cent. Other Chinese exports that retreated in both value and volume terms included laptops and tablets, video-game consoles, networking equipment and lithium hydroxide.
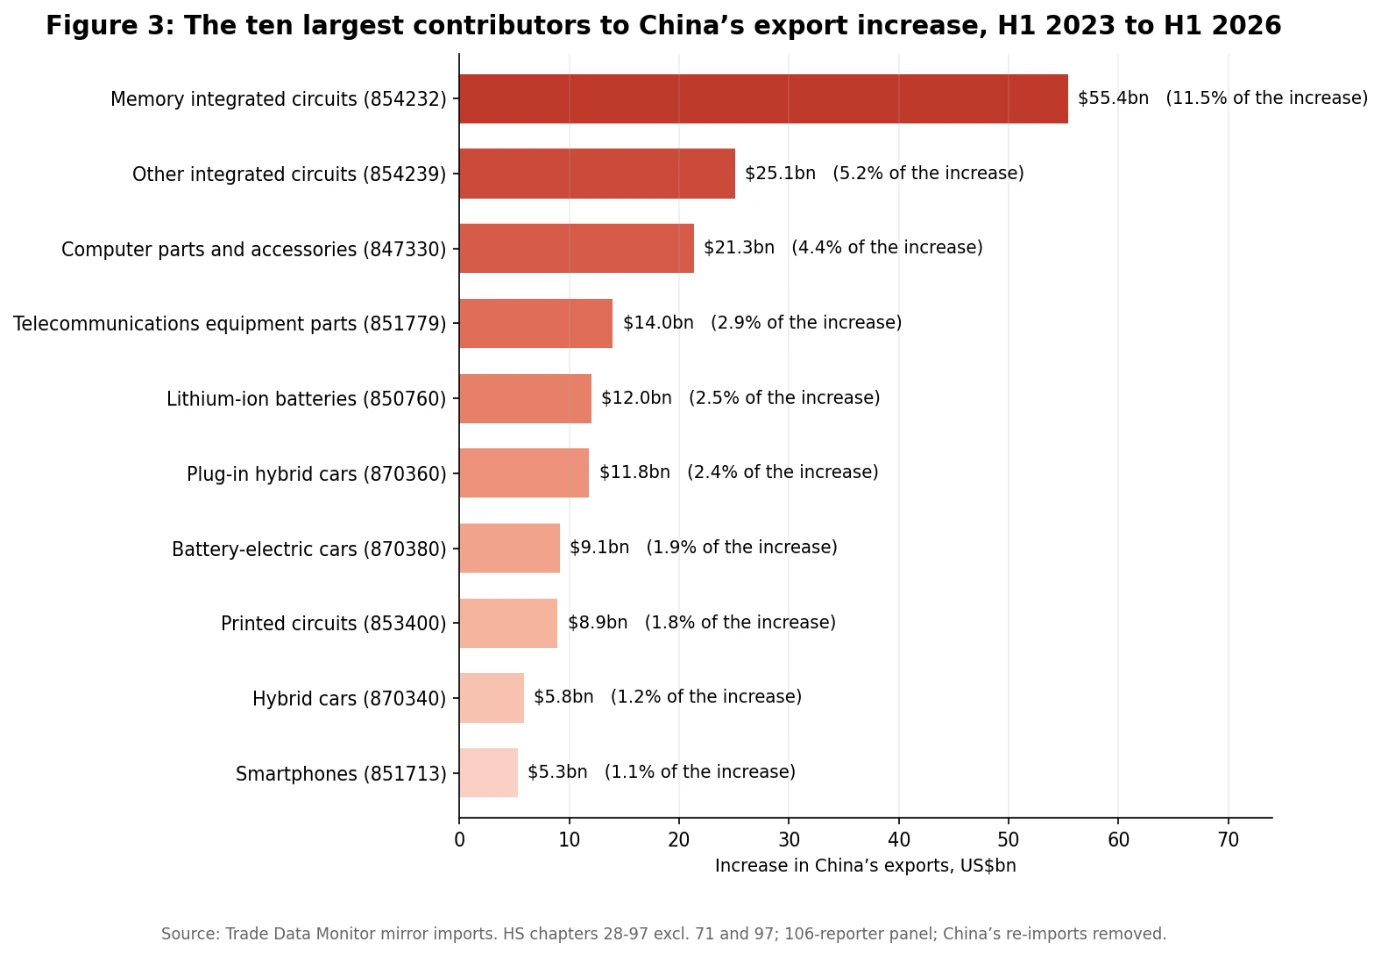
China’s manufactured-export growth is concentrated in a small number of product lines. Just 36 of the manufacturing product lines exported by China account for half of the $484 billion gross increase between H1 2023 and H1 2026. Figure 3 identifies the top ten contributors, which account for $168.8 billion of the gross export increase. In contrast, 416 Chinese manufactured products saw their exports grow by 0 to 3 per cent per annum on average over the same timeframe and 2,175 HS6 product lines witnessed falling export values. Such findings cast doubt on fears of an across-the-board increase in Chinese exports in recent years.
China’s export growth in recent years is concentrated in upstream products. Several of the largest increases are in the semiconductor and computing supply chains associated with the AI and data-centre investment boom, including memory chips, other integrated circuits, computer parts, and printed circuits. More generally, among the 100 products contributing most to China’s gross export growth, 75 per cent of the increase came from components and intermediates and only 25 per cent from finished goods. This differs from the rest of the world, where there is a 59 to 41 split in favour of parts and components. Since the start of 2023, for example, finished computing devices added only about $10 billion to China’s exports, compared with $373 billion for the rest of the world.
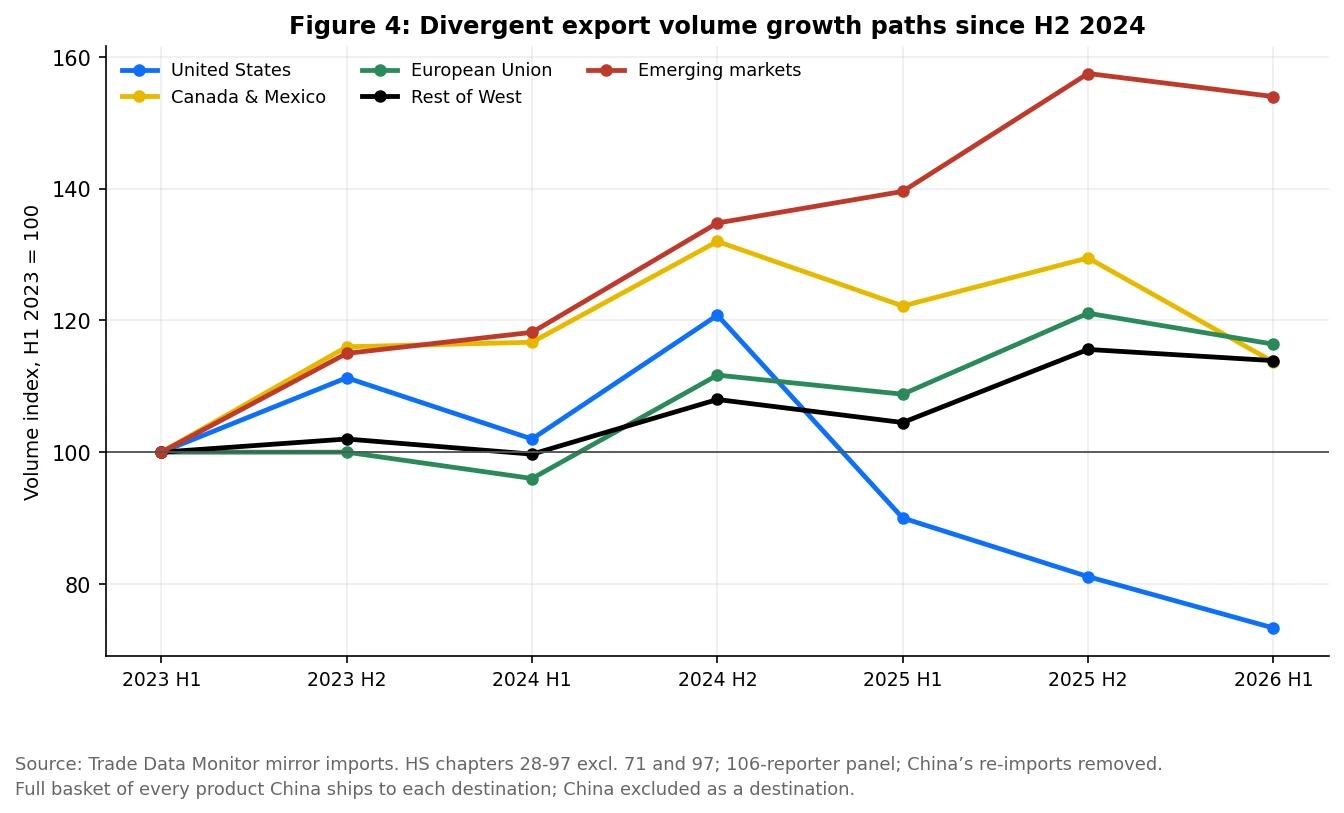
China’s trading partners differ markedly in how much additional Chinese manufactures they have absorbed in recent years. The destination analysis uses the full basket of every product China ships to each destination, weighted by that destination’s own imports. Relative to an H1 2023 base, Chinese export volumes to the United States fell by 27 per cent. By contrast, they rose 16 per cent to the European Union and 54 per cent to emerging markets. Indeed, the divergence between Western economies and the emerging markets is stark and growing further (see Figure 4).
Chinese manufactured-export prices rose less than non-Chinese prices in every destination group examined. In the European Union, the Chinese price index reached 100.7, compared with 109.8 for other suppliers. In emerging markets the gap was larger: 107.4 versus 125.7. The corresponding figures were 101.7 versus 117.2 in the Rest of the West[2] and 102.4 versus 123.0 in Canada and Mexico. The United States stands out: Chinese prices fell to 83.1, while non-Chinese prices rose to 120.9. These patterns are relevant to concerns about price competition, but they do not by themselves establish dumping, which requires a different legal and economic test.
Worries that Chinese products are flooding world markets abound. Are they confirmed by this data? On the cleanest, like-for-like basis I can construct using available import data, the total value of Chinese exports has risen 27.1% in nominal terms from H1 2023 to H1 2026. However, that headline percentage masks the fact that China’s recent manufactured-export growth is concentrated in a relatively small number of products.
Moreover, those extra exports have not been uniformly shipped to China’s trading partners. There is a clear divergence between Western economies and emerging markets in this regard, in particular since the middle of 2024.
Given the significant increases in demand for imported goods witnessed in recent years (as evidenced in the last piece I wrote in this series), perhaps the most striking difference is that Chinese exporters responded by increasing volumes sold a lot and raising prices a little and exporters in the rest of the world did the reverse. That foreign exporters were able to raise average export prices 16 per cent more than Chinese rivals may be one of the least known aspects of the much-discussed China Shock 2.0.
Simon J. Evenett is Professor of Geopolitics & Strategy, IMD Business School, Lausanne, Switzerland; Co-Chair, Trade & Investment Council, World Economic Forum; Founder, St. Gallen Endowment for Prosperity Through Trade, the institutional home of the few remaining independent trackers of digital, trade, industrial, subsidy and investment policy.
I use mirror import data from the Trade Data Monitor to assemble a constant panel of 106 reporting economies that covers HS chapters 28–97, while excluding trade in chapter 71 on precious metals and chapter 97 on works of art. I also exclude China’s recorded imports from China—processing-trade goods that leave and re-enter, worth some $89 billion in H1 2026—since these are not exports to a foreign market.
Defined here as Australia, Iceland, Japan, Korea, New Zealand, Norway, Switzerland, and UK.