Which foreign suppliers depend most on US market access? A sectoral analysis in the shadow of America’s turn inward
ZEITGEIST SERIES BRIEFING #42
ZEITGEIST SERIES BRIEFING #42

During the recent US presidential campaign, Donald Trump pledged to raise tariffs on Chinese imports by at least 60% and on imports from the rest of the world by 10% (later in the campaign he mused about raising that to 20% tariffs). Given that the United States routinely imports more than $3 trillion of goods each year, loss of access to the US market would take a large bite out of the “top line” (revenues) of many foreign firms.
But it would be wrong to associate America’s inward turn only with Republicans. The Biden Administration took various measures in May 2024 to restrict US market access. Plus, Kamala Harris hardly burnished open trade credentials on the campaign trail—unsurprising given how many of the “Rust belt” states are also electoral “swing states”. A balanced assessment of the past 8 years is that, as far as trade policy is concerned, America is turning inward.
Sectors differ in exposure to US buyers—in absolute and relative terms—so blanket statements about exposure to America’s inward turn are unwise. This begs the question: which foreign suppliers are more vulnerable to losing US market access? This matter is examined here using international trade data, leveraging the United Nations’ practice of grouping products into “chapters” of their Harmonized System (HS).
The goal here is not to predict how restrictive the next US Administration’s policy towards imports will be. Nor is it to quantify the impact of any new American trade barriers. Rather, it is to put numbers on the exposure of foreign sectors to losing access to the United States market. To fix ideas, the focus here is on the worst case scenario—when access to the United States’ market is lost entirely. Given that service sector international trade data is so patchy, only foreign goods producers are considered here.
A foreign sector is more vulnerable to loss of access to the US market when:
1. The total value of exports to the US is larger.
2. US exports are a larger share of global cross-border sales.
3. Non-US exports in that sector grow slower (or not at all).
The first factor identifies the revenue hit if market access is lost and no further measures are taken. The second factor indicates (perhaps imperfectly) the size of the market elsewhere for goods previously shipped to the US. The third factor indicates the growth in the size of those alternative export destinations.
Exporters to the US have agency: the first factor provides them with the incentive to respond; the second and third factors correlate with the potential for redirecting exports (“trade deflection” in trade policy parlance.) Each of these is observable, allowing exposure to be quantified.
The last year for which a full set of United Nations’ international trade data is available (from the COMTRADE database) is 2022. The following calculations were performed for the 96 sectors where the United States imported goods in 2022.
Data from that year was used to compute the total value of each sector’s exports to the United States and the share of total exports to the USA in global exports in a given sector.
To assess the growth in non-US imports of a sector’s products, the annual cumulative growth rate of total non-US imports between 2012 and 2022 was calculated. In the 84 sectors that saw non-US imports grow from 2012 to 2022, it was possible to calculate the number of years it would take for non-US imports to grow so as to fully compensate for loss in US market access.
For the sake of argument, assuming that the US market is going to be closed in 2025, it was then possible to calculate for each of these 84 sectors in which year the growth in non-US import growth would compensate entirely for the loss of US market access in 2025. [1] Such year estimates and other calculations are reported in the Annex Table for each HS Chapter (or sector).
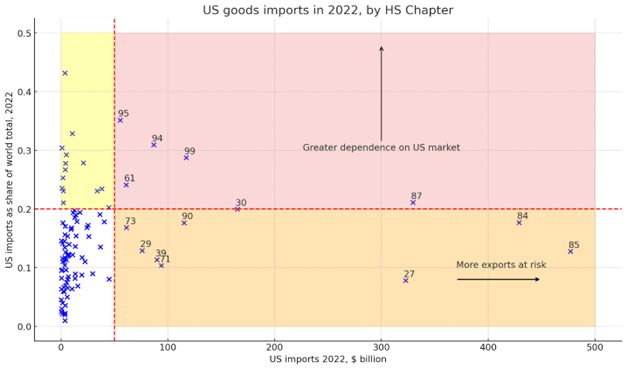
This empirical approach revealed several findings. First, as shown in Figure 1, the 96 sectors fall into four groups: those with significant exports to the USA in 2022 (taken to be more than $50bn) and those where dependence on the US market is above 20%. The high export volume-high dependence quadrant (shaded red in that figure) accounts for 19.7% of total US imports in 2022. The lower bottom quadrant—indicating high values of exports but less dependence on the US market—accounts for 55.4% of total US imports in 2022. The upper left quadrant accounts for another 5.2%, implying that a quarter of total US imports are in sectors where more than a fifth of global cross-border sales take place in the USA.
Figure 1 reveals that 4 HS Chapters (27, 84, 85, and 87) account for the bulk of US goods imports. Clear differences exist between these jumbo sectors: Chapter 27 (crude oil) is smaller in commercial value than Chapters 84 (engines, computers) and 85 (telecoms equipment and semiconductors) but has more options for redirecting sales to foreign markets. Chapter 87 (road vehicles) has similar commercial scale as Chapter 27 but high US market dependence.
Figure 1: Six large sectors depend on the US market for more than 20% of cross-border sales.
For all of the sectors where US imports exceeded $25 billion in 2022, Figure 2 reports the year in which non-US import growth would have been sufficient to offset complete loss of access to the United States’ market. The sectors are organised along the vertical axis in terms of increasing value of total imports into the US in 2022.
Growth in cross-border sourcing outside the United States is only significant enough in 6 sectors (HS Chapters 38, 76, 72, 39, 27, and 85) to ensure that, if current demand growth continues, loss US market sales would be recovered by 2030.
In 8 sectors non-US import growth is so weak that full replacement of lost US market sales would, on current trends, take place after 2035. These findings highlight the importance of the growth (and penetration) of alternative export destinations in assessing a sector’s vulnerability to a further inward turn by the United States.
Figure 2: Redirecting US shipments to other markets helps only a few sectors recover by 2030.

The economy-wide picture is revealed in Figure 3—which shows what percentage of loss US goods market access will be made up in each future year assuming that 2012-22 growth dynamics outside the United States continue. After 10 years, non-US import growth would replace less than 60% of the lost US market access. Eighty-percent would be recovered within 15 years. These timeframes are too long for most executives—highlighting the importance of a proactive posture in response to potential American market closure.
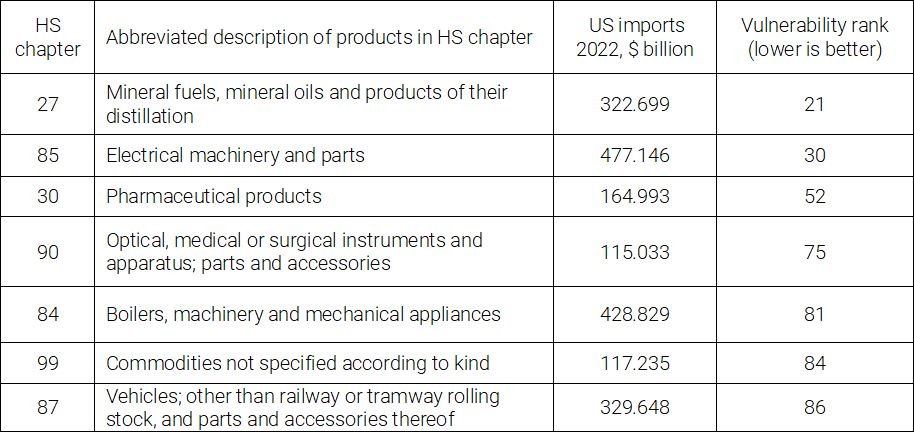
Using information on dependence on the US market and years to full recovery of lost exports, it was possible to rank all 96 sectors. The table overleaf reports the ranking for the sectors where more than $100 million was exported to the US in 2022. That table reveals that foreign suppliers of road vehicles, engines, computer hardware, and medical devices face more risk than counterparts supplying crude oil, pharma products, batteries, telecoms equipment, and semiconductors.
This exposure analysis revealed those sectors more vulnerable to further American retreat from open trade. That retreat can be partial and take many forms—not complete, as assessed here. Still, it is valuable to scale, broadly speaking, what is at stake and to make evidence-based cross-sectoral comparisons.
As America turns inward, the risk of tariff hikes and other import barriers grows. Forward-looking firms should explore the commercial case for geographic sales diversification. This could involve, amongst others, the pursuit of new customer segments in the faster-growing emerging markets. Consideration should also be given to further de-risking from the US market.
Even if higher import barriers do not result, enhanced trade policy uncertainty will take its toll on investment, market entry, and sourcing decisions. Fortunately, as the modest shares exported to the US reported in Figure 1 imply, there are plenty of commercial opportunities beyond the United States.
Figure 3: If non-US imports continue their decade-long growth rates, it will take more than 7 years to make up half the revenues lost in the US market.

Table: Mineral fuels (crude oil), electrical machinery, and pharmaceutical products are the least vulnerable of the sectors shopping more than $100 billion to the United States.
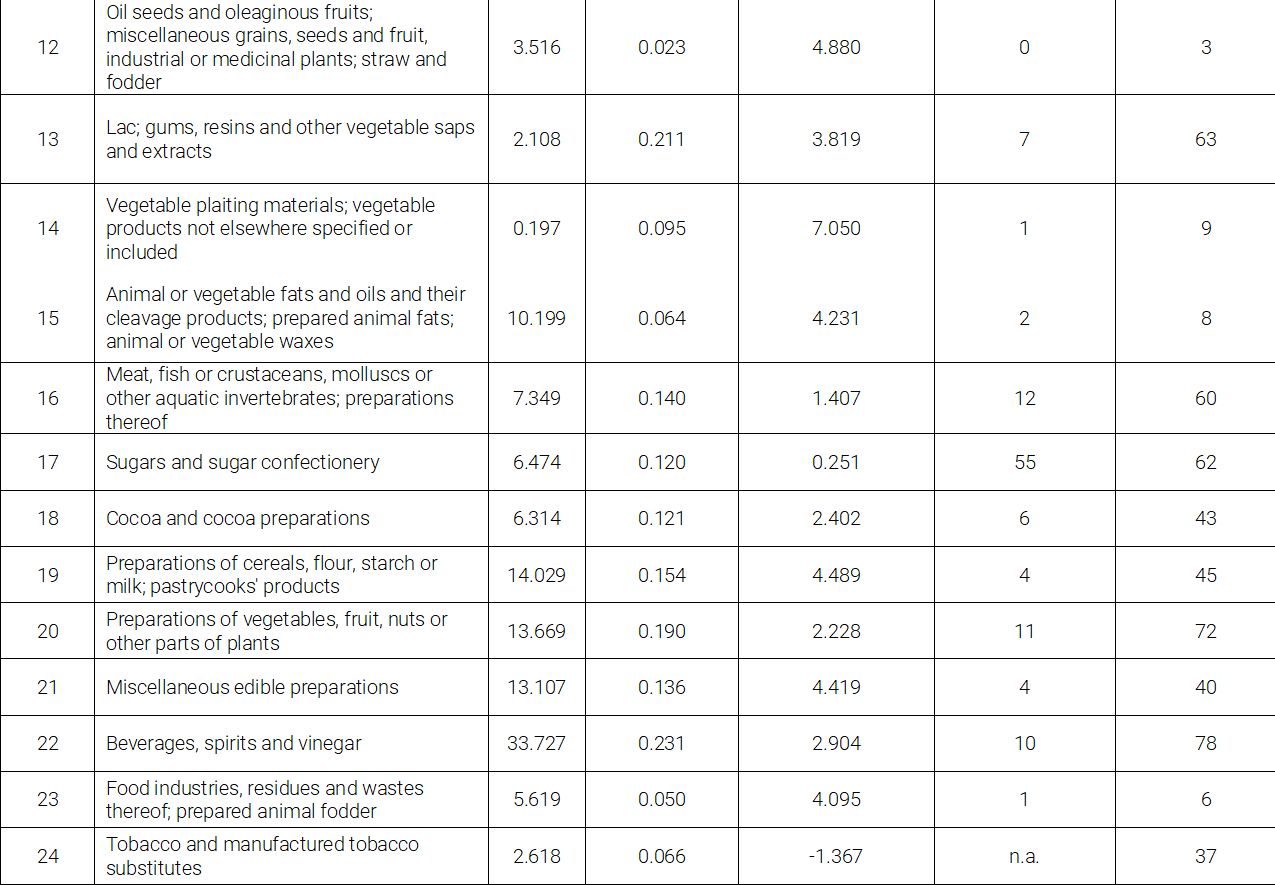
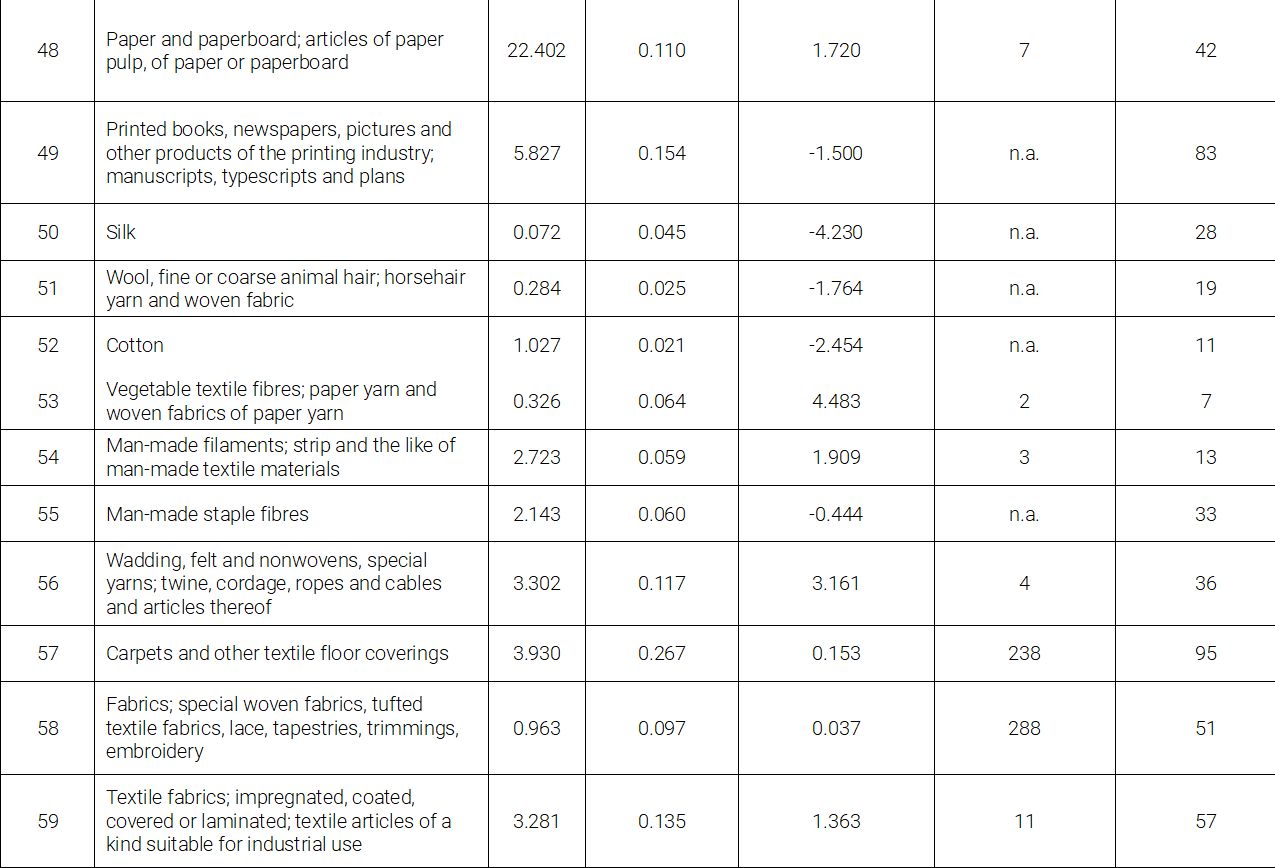
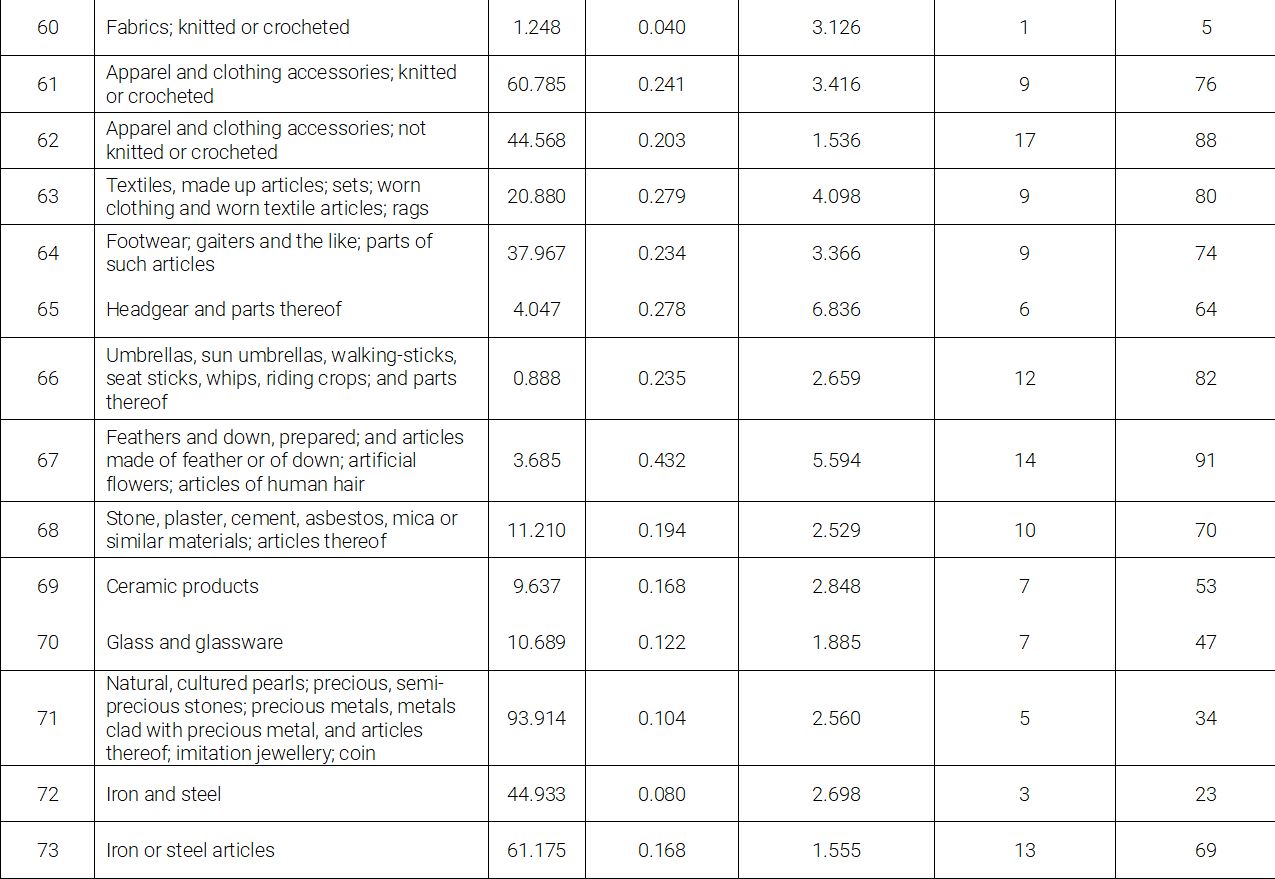
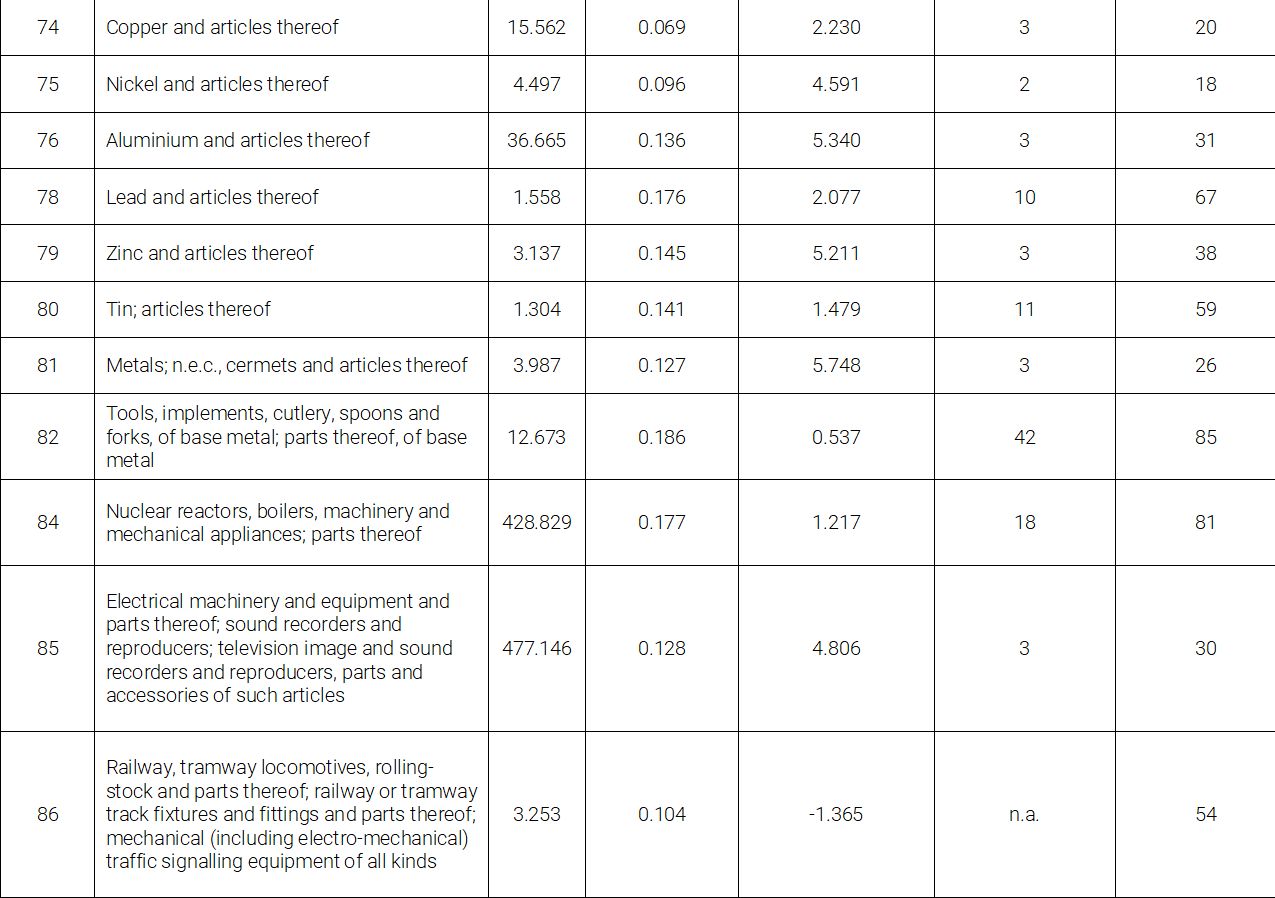
Annex Table: Sectoral assessment of goods export exposure to the US market, by HS Chapter.
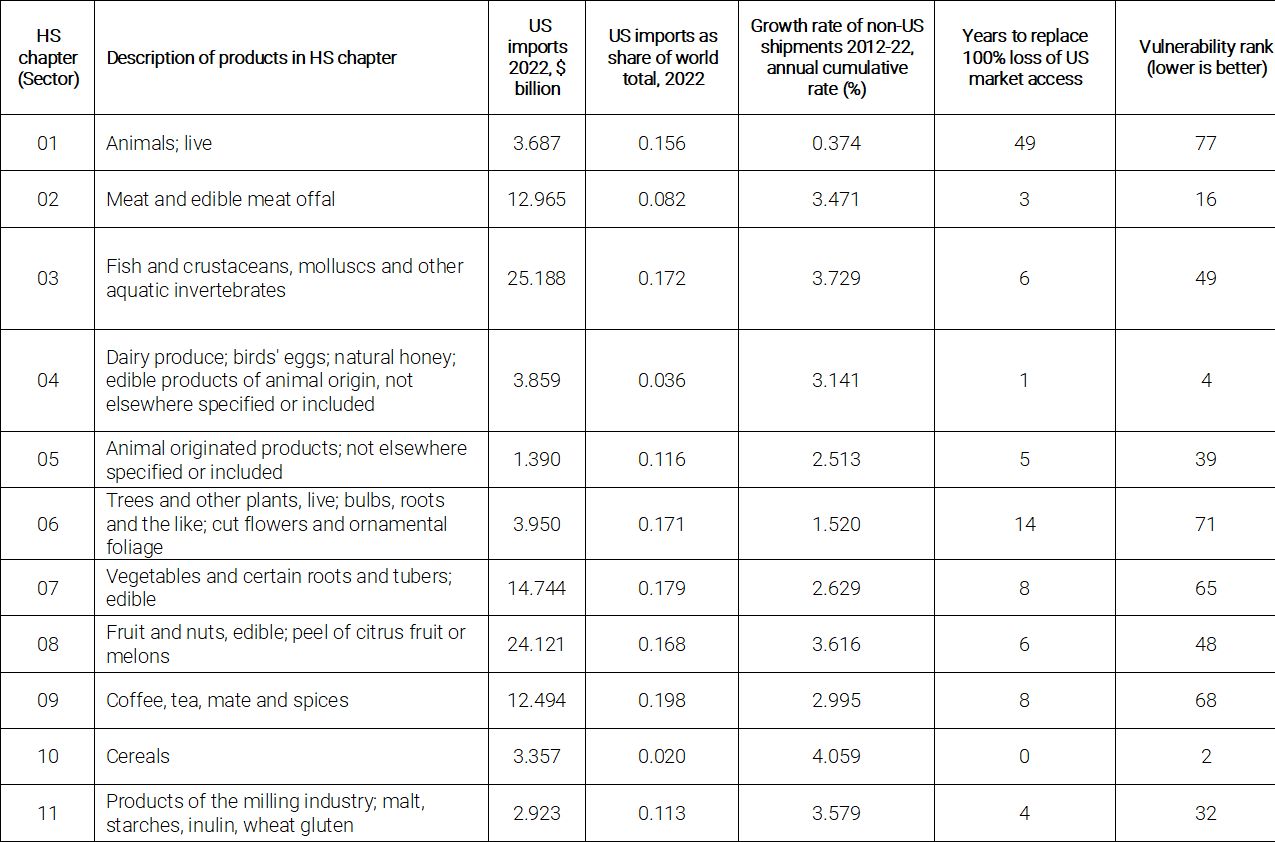

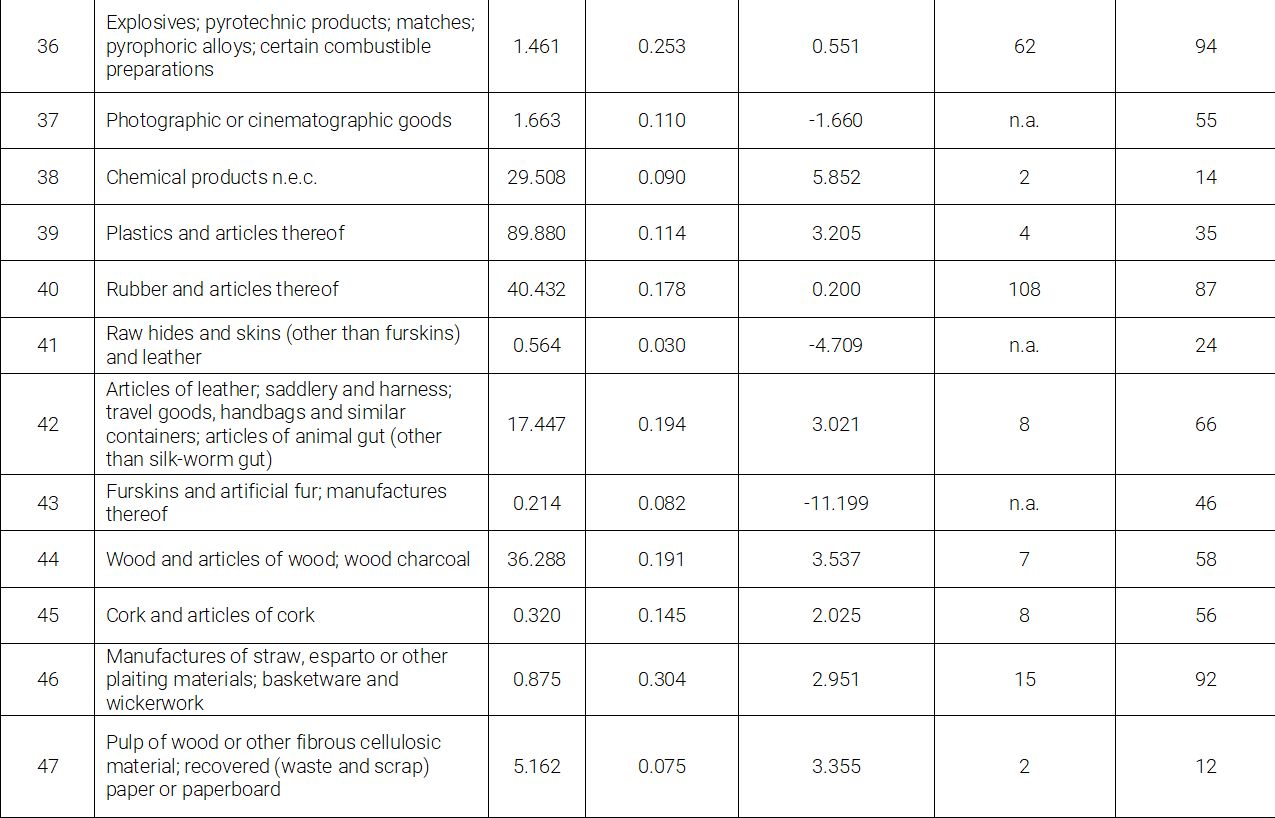

Notes for the Annex Table:
Data source: UN COMTRADE for all international trade data.
Calculations for the number of years of growth of non-US markets to replace lost US export sales were only possible for sectors where total non-US imports in 2022 exceeded the level recorded in 2012. This condition failed in 12 sectors (HS Chapters).
The Vulnerability rank was ascertained by ranking the HS Chapters separately by (a) US imports as a share of world total, 2022 (indicating current opportunities for redirection of exports from the US market) and (b) years to replace 100% loss of US market access (which is heavily influenced by the speed with which non-US markets are growing). The Vulnerability rank is the geometric mean of the ranking of HS Chapters based on (a) and (b). Throughout lower ranks indicate less vulnerability. Note that lower vulnerability should not be confused with no vulnerability.
Simon J. Evenett, an international trade economist, is Professor of Geopolitics & Strategy at IMD Business School, Switzerland. He is also Founder of the St. Gallen Endowment for Prosperity Through Trade, which is the home of the independent monitoring initiatives Global Trade Alert, Digital Policy Alert and the New Industrial Policy Observatory and Co-Chair of the World Economic Forum’s Global Futures Council on Trade & Investment.
If the closure of the US market to imports triggered other nations to follow suit, then redirecting exports to markets outside of the United States would take even longer to make whole the loss of US export sales.