Trade Redirection of Chinese Exports During 2025: Evidence from Full-Year Data
ZEITGEIST SERIES BRIEFING #84
ZEITGEIST SERIES BRIEFING #84
Simon Evenett
18 Feb 2026

Concerns that Chinese products—shut out of American markets on account of the tariffs imposed during 2025—are flooding world markets are top-of-mind for many policymakers and corporate executives.
Although decisions to raise import barriers are often made on a selective, case-by-case basis, concerns about a flood of Chinese exports have a systemic dimension. These concerns have been used to argue for raising import barriers across the board against Chinese goods, creating a channel through which last year’s unilateral tariff measures by the United States may spread. To date, emulating American tariff hikes has not happened.
The availability of the full set of monthly Chinese export data for 2025 provides an opportunity to reassess these concerns using observed outcomes, rather than partial-year evidence or conjecture. This note summarises the findings from the recent release of December 2025 Chinese export data to quantify the extent of trade redirection in 2025 and to place it in context.
A necessary starting point is the size of the initial trade disruption. In 2025, Chinese exports to the United States declined by less than USD 115 billion relative to their average annual level in 2022–2024, the baseline years for this analysis. During that baseline, world trade in goods averaged around USD 23.5 trillion and total Chinese exports to the United States averaged USD 533 billion. Of course, not every lost export sales in the United States must be redirected to third markets.
Trade redirection refers to a change in the distribution of an exporter’s sales across destination markets, after controlling for changes in the total value of the exporter’s worldwide sales in foreign markets. A destination experiences positive redirection when its share of total exports rises relative to a baseline period, and negative redirection when its share falls. Positive redirection could, in principle, be associated with import surges in the recipient nation—triggering concerns among import-competing firms.
This note uses the term trade redirection throughout. However, some commentators use the term “trade diversion”. Conceptually, however, trade diversion refers to reallocation induced by preferential tariff arrangements, whereas the phenomenon analysed here concerns exporter responses to unilateral resort to import barriers by a third-party government.
A number of influential commentators have argued that higher U.S. tariffs would lead to large-scale reallocation of Chinese exports. Representative claims of this nature are reproduced below.
The Rhodium Group states that “higher trade barriers are likely the new norm, reducing bilateral trade between the world’s two largest economies. In the medium term, that trade will likely be redirected, with third countries backfilling China’s market share in the US and Chinese exporters seeking alternative markets elsewhere” (Boullenois and Smith, 2025).
Writing in December 2024, Stephen Roach argued that, following earlier tariff increases, “the Chinese portion was simply diverted to Mexico, Vietnam, Canada, Korea, Taiwan, India, Ireland and Germany” and that “expect more of the same in a second Trump administration” (Roach, 2024).
Joseph Cotterill writes that “emerging markets [are] set to become battlegrounds in [the] trade war”, arguing that Chinese exporters will face pressure to “replace now heavily restricted access to the US … with new sources of demand” (Cotterill, 2025).
The European Commission President has similarly warned that US tariffs may redirect trade towards third markets, warranting monitoring and possible trade defence action (von der Leyen, 2025).
These claims share a common premise: that exports displaced from the US market would be redirected elsewhere at scale. Notice these claims do not refer to sectoral trade redirection—they refer to national effects, the focus in this note.
Between the 2022–2024 average and 2025, China’s exports worldwide increased materially. In nominal USD terms: total exports in 2025 were approximately USD 272 billion higher than the 2022–2024 average, corresponding to an increase of 7.7 per cent. Recall, all twelve months of Chinese export data for 2025 are now available.
This expansion in Chinese exports worldwide is said by many to reflect domestic macroeconomic conditions and enhanced Chinese export competitiveness, and is not itself evidence of trade redirection.
This point is critical. If total exports rise, some destinations may receive more Chinese goods even if their share of Chinese worldwide exports falls; that is, even if there is redirection of Chinese exports away from a particular foreign destination. Any assessment of the extent of trade redirection must therefore control explicitly for this scale effect.
The analysis uses the available Chinese export data reported by Chinese Customs, as assembled, cleaned, and cross-checked by a highly reputed international Trade Data Monitor. The data cover monthly exports to all partner countries and are reported in USD.
The baseline is defined as the average of 2022–2024, rather than 2024 alone. This choice reduces the sensitivity of the results to any abnormal trade patterns in a single year and diminishes the impact associated with any post-pandemic adjustments, inventory cycles, and one-off shocks.
Exports in 2025 are compared with this baseline using a shift–share decomposition that isolates scale and redirection effects. The key question is whether the share of Chinese worldwide exports despatched to a given trading partner is higher or lower in 2025 than in the baseline years.
The empirical results show that trade redirection in 2025 was substantial in some cases, limited in others, and highly uneven across destinations.
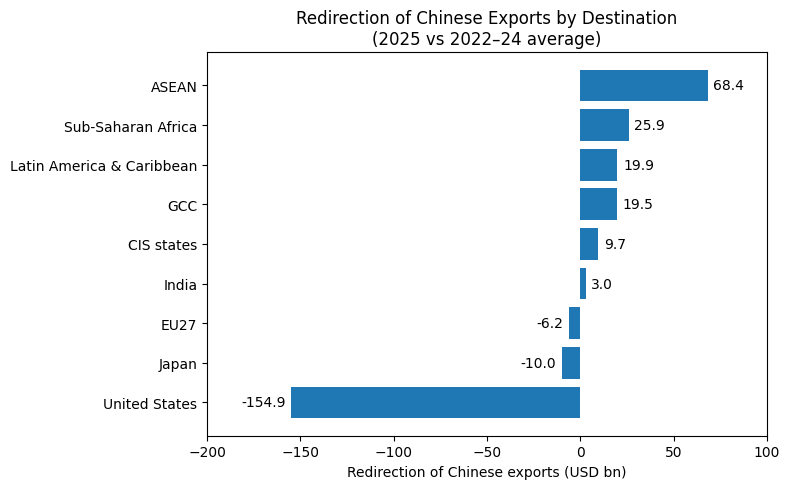
Among destinations experiencing negative trade redirection, perhaps unsurprisingly given the very purpose of higher tariffs is to reduce sourcing from a targeted exporter, the United States stands out. Chinese exports to the US fell by approximately USD 110–120 billion in 2025 compared with the 2022–2024 average.
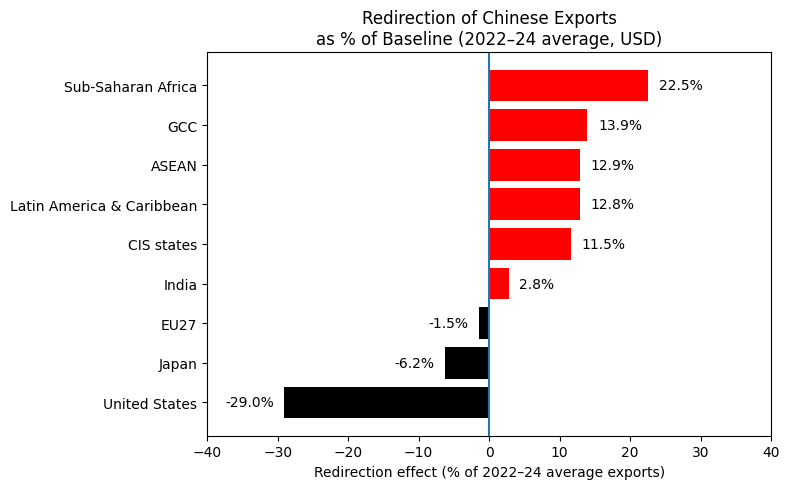
The redirection component of this change amounts to roughly USD 150 billion, meaning that the loss of export share alone exceeded the observed decline in export levels. In relative terms, this redirection component represents a reduction equivalent to approximately 30 per cent of China’s exports to the US in the baseline years before the latest trade war. Expressed differently, had the US maintained its prior share of Chinese exports, exports to the US would have risen in 2025 rather than fallen.
Japan also experienced negative trade redirection, though on a much smaller scale. Exports from China to Japan declined by around USD 3 billion in level terms. The redirection effect is estimated at approximately USD 10 billion, equivalent to about 6 per cent of baseline exports. As in the US case, the observed decline is fully attributable to a loss of export share, with China’s overall export growth partially offsetting the negative redirection effect.
The European Union is another case of negative export redirection. Chinese exports to the EU increased in absolute terms in 2025. Nevertheless, the redirection effect is negative, at approximately USD 6 billion, corresponding to around 1–2 per cent of baseline exports. This indicates that the EU’s share of Chinese exports declined slightly during 2025.
However, there is significant variation across EU member states in the extent of Chinese export redirection—see the Annex to this note. Five member states experienced Chinese export redirection towards their markets each in excess of USD 1 billion. Meanwhile, four member states saw Chinese exports directed away from their markets to the tune of at least USD 1 billion. Overall, the total redirection away from individual EU markets in 2025 exceeded the redirection towards individual EU economies.
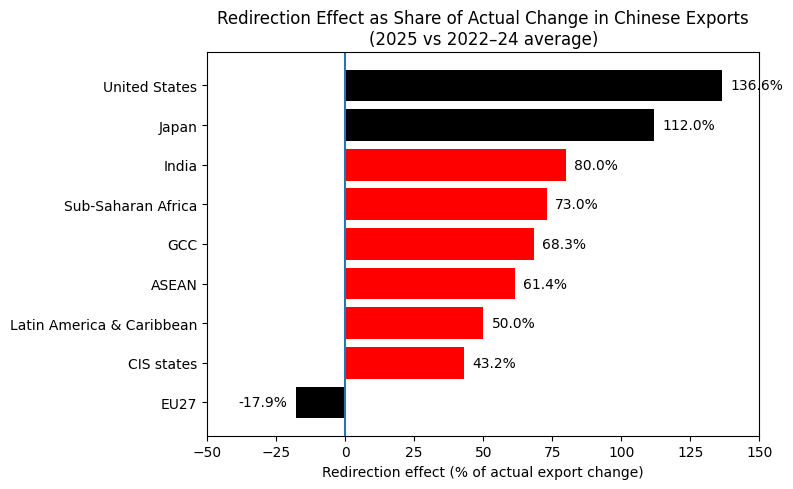
Turning to destinations experiencing positive trade redirection, ASEAN absorbed the most extra Chinese exports. The redirection effect for ASEAN amounts to approximately USD 65–70 billion, equivalent to around 12–13 per cent of baseline exports. Redirection accounts for roughly 60 per cent of the observed increase in Chinese exports to ASEAN, with the remainder explained by scale effects.
Latin America and the Caribbean also absorbed a meaningful volume of redirected exports. The estimated redirection effect for the entire region is approximately USD 20 billion, corresponding to 12–13 per cent of baseline exports. In this region, redirection explains around half of the observed growth in Chinese exports, indicating a balanced contribution of scale and reallocation.
On some metrics, Sub-Saharan Africa experienced significant Chinese trade redirection. The redirection effect is estimated at approximately USD 25–26 billion, exceeding 20 per cent of baseline exports. More than 70 per cent of the increase in Chinese exports to the region in 2025 is attributable to redirection.
The Gulf Cooperation Council also absorbed a substantial share of redirected exports. Redirection to the GCC amounts to approximately USD 19–20 billion, or around 14 per cent of baseline exports. Approximately two-thirds of the increase in Chinese exports to the GCC is explained by redirection.
Taken together, these results show that Chinese trade redirection in 2025 was highly uneven across trading partners and material in some emerging market regions with ASEAN standing out for absorbing nearly USD 70 billion of extra Chinese exports.
Each chart presented here scales the same Chinese export redirection in different ways.
The first chart, showing absolute USD values, identifies where the largest volumes of redirected trade went. It establishes that ASEAN, Latin America and the Caribbean, Sub-Saharan Africa, and the GCC absorbed most redirected exports.
This chart also shows that there is no evidence in aggregate trade flows of Chinese redirection of exports (from the US market or anywhere else for that matter) to Japanese and EU markets. Critically, this implies that any European and Japanese sectors claiming to be swamped by redirected Chinese exports are not representative of the overall trade position.
The second chart, expressing estimated Chinese export redirection relative to baseline exports, shows the intensity of reallocation for each destination. This highlights that redirection was particularly significant for the GCC members relative to the size of their pre-existing trade relationships with China.
The third chart, expressing redirection as a share of the overall export change with China, clarifies attribution. It shows that declines in exports to the US and Japan are entirely explained by redirection, while growth in Chinese exports to the EU observed in 2025 occurred despite negative redirection. The latter finding implies that—if Chinese imports into the EU are a concern—it is because of the overall increase in Chinese exports worldwide and not due to redirection of Chinese exports from the United States market.
The total volume of Chinese exports redirected away from the US market in 2025 amounts to approximately USD 150 billion, equivalent to just 4.2 per cent of China’s global exports before the latest trade war (2022–2024).
When benchmarked against the average value of world imports during the baseline years (USD 23.5 trillion), trade redirection of the order of USD 150 billion is a drop in the bucket. It is not credible to argue that redirecting USD 150 billion of Chinese exports disrupted global trade flows that were 156 times larger. Redirection of Chinese exports from the United States market in 2025 did not create a system-wide shock to global trade. No wonder system-wide increases in import tariffs did not come to pass.
However, Chinese export redirection was significant for groups of developing countries. The findings presented here show that Chinese trade redirection in 2025 was geographically concentrated. On different metrics, ASEAN, GCC and Latin American and Caribbean nations stand out as destinations for extra Chinese goods.
The focus of this note is on providing estimates of Chinese export redirection—not on the overall quantum of Chinese exports worldwide. The latter has become a separate source of concern in certain trade policymaking circles and is worthy of separate analysis.
The value of this note lies in scaling a salient trade policy dynamic. With full-year data now available, trade redirection in 2025 can be assessed empirically rather than impressionistically. Future data will determine whether these patterns persist, but the evidence for 2025 points to focused reallocation of Chinese exports towards emerging market destinations.
In higher per-capita income economies, Chinese export surges in particular sectors must have been offset by unusual falls in other sectors. Tariff-induced redirection of Chinese exports did not cause a flood into EU and Japanese markets. Proponents of across-the-board import restrictions on Chinese goods will need to look elsewhere for empirical support.
These findings beg the question why the EU and Japanese markets were spared from Chinese export redirection. A reader of an earlier version of this note argued that higher regulatory standards in Europe and in Japan (as compared to emerging markets) could have discouraged Chinese exporters from redirecting exports there. If correct, this suggestion implies that EU and Japanese import-competing sectors have already been “protected” by technical barriers to trade (safety regulations etc). In turn, this undermines the case for protecting them further with higher import barriers.
Simon J. Evenett is Founder of the St. Gallen Endowment for Prosperity Through Trade, Professor of Geopolitics and Strategy at IMD Business School, Lausanne, Switzerland and Co-Chair of the World Economic Forum’s Trade & Investment Council. Comments can be sent to him at simon.evenett@sgept.org
The table below ranks EU member states by the magnitude of Chinese export redirection in 2025, measured in USD billions. Rows are shaded red where export redirection exceeds USD 1 billion, indicating a material increase in the share of Chinese exports directed toward that member state. Rows are shaded green where export redirection is less than −USD 1 billion, indicating a material reduction in the share of Chinese exports.
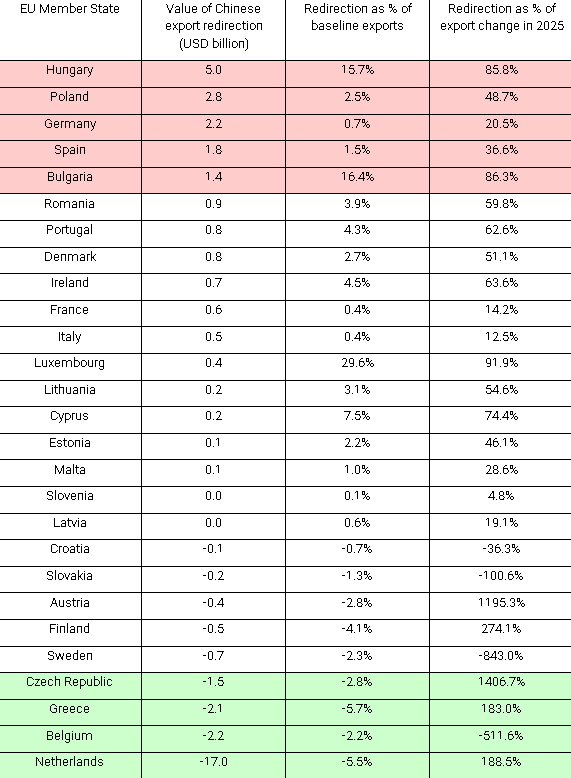
This table implies the EU-level total reported in the main text conceals significant variation across the Member States. Hungary is at the top of the ranking because it absorbed the largest redirection of Chinese exports in absolute terms (about USD 5 billion), which is also large relative to its pre-trade war imports from China (around 16% of baseline trade). This reflects a corresponding increase during 2025 in Hungary’s share of Chinese exports, not merely growth driven by China’s overall export expansion.
Germany sits high in the ranking in absolute terms but shows a much smaller gain relative to baseline exports (under 1%). This combination implies that recent changes in Germany’s imports from China are driven mainly by scale—China exporting more worldwide—as opposed to a pronounced reallocation of export shares toward Germany. Overall, Germany experienced very limited redirection.
At the other end of the table, the Netherlands has the highest level of negative redirection within the EU, with an estimated USD 17 billion loss of Chinese imports due to its reduced share of Chinese exports. While this is sizeable in absolute and relative terms (about 5.5% of baseline exports), it may reflect the Netherlands’ role as a logistics and re-export hub rather than a contraction of final demand for Chinese goods in the Dutch economy.