
One Year Since Turnberry: What has changed in transatlantic trade since then?
ZEITGEIST SERIES BRIEFING #97


ZEITGEIST SERIES BRIEFING #97
Simon Evenett
27 Jul 2026

The Turnberry deal, agreed at a political level on 27 July 2025 and elaborated in the 21 August 2025 Joint Statement, established a framework intended to stabilise transatlantic trade while reducing bilateral trade tensions. The deal came into effect on 1 September 2025.
Under the agreement, the United States established a ceiling of 15% for import tariffs on most EU exports, while the European Union committed to eliminate tariffs on U.S. industrial goods and improve market access in selected agricultural sectors. Beyond tariffs, the two sides agreed to work towards reducing non-tariff barriers through greater regulatory cooperation, including mutual recognition in some industrial sectors and streamlined conformity assessment procedures.
The EU also announced plans to procure US$750 billion of U.S. energy products by the end of 2028, purchase at least US$40 billion of U.S. AI chips, substantially increase procurement of U.S. defence equipment, and facilitate US$600 billion of additional European private sector investment in the United States. Together, these commitments were presented as strengthening transatlantic supply chains, supporting reindustrialisation, and creating a more balanced and predictable bilateral economic relationship.
The following data provide context for the ensuing negotiation. In 2024, the year before President Trump returned to power, the EU goods trade surplus with the United States totalled $236.7 bn. Seven of the EU Member States ran goods trade deficits with the U.S. that year. Of the 20 economies that ran surpluses, Ireland, Germany, and Italy stand out, with goods trade surpluses of $86.5 billion, $84.6 billion, and $43.5 billion, respectively.
As is the EU’s practice, trade policy matters are negotiated by the European Commission on behalf of all 27 Member States. The upshot is that all 27 Member States faced a “Liberation Day” tariff of 20%. Had each Member State been treated separately, 11 would have faced the minimum tariff of 10% (including Belgium, the Netherlands, Poland and Spain). In contrast, five would have faced tariffs of 35% or above (Slovenia, Slovakia, Ireland, Austria, and Hungary). The negotiation and implementation of the Turnberry deal was therefore a test of EU solidarity which, by and large, the Member States passed.
Following the Trump Administration’s focus on goods trade, the following analysis concerns merchandise trade only. Consequently, services trade and investment flows are not considered here. Separately, readers should bear in mind that factors other than the Turnberry deal—including exchange rates, business-cycle conditions and sector-specific developments—may have influenced transatlantic trade flows since this deal came into force.
One year on from the political deal in Scotland, how much has EU-US goods trade changed? The increase in EU goods exports to the United States during the first half of 2025, widely attributed to firms bringing shipments forward ahead of anticipated tariff increases, complicates any assessment of the Turnberry agreement. For that reason, the most informative benchmark is not 2025 as a whole, but the corresponding periods in 2024.
My comparison is split into two parts. The first examines September–December 2025, the period immediately following implementation of the Turnberry agreement on 1 September 2025, against the same months in 2024. The second compares January–May 2026 with January–May 2024 (May 2026 being the last month of available US customs data). This split allows for the possibility that unusually strong exports before the agreement may have been followed by weaker exports in late 2025 as firms worked through inventories accumulated during the front-loading episode. US Customs data, assembled by Trade Data Monitor, was used throughout.
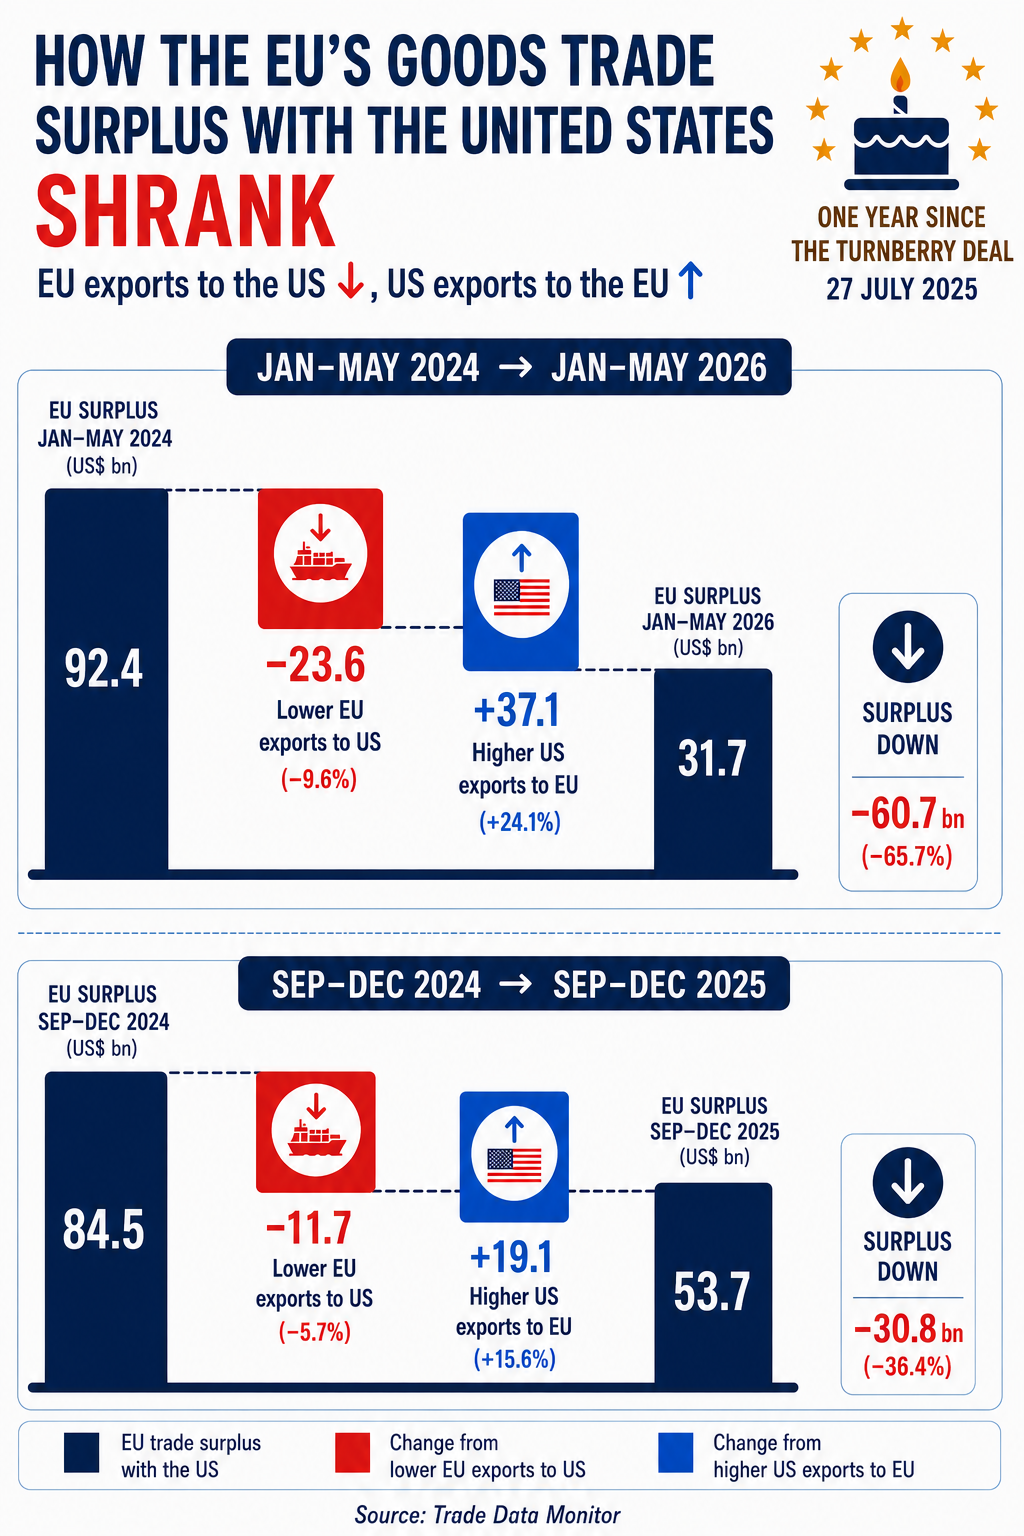
Both comparisons point to the same conclusion: Turnberry implementation has been associated with a marked contraction in the EU's bilateral goods trade surplus with the United States. During September–December, the surplus fell from US$84.5 billion in 2024 to US$53.7 billion in 2025, a reduction of US$30.8 billion (36.4% down). Between January and May, it declined even more sharply, from US$92.4 billion in 2024 to US$31.7 billion in 2026, a fall of US$60.7 billion (or 65.7% down).
In both periods, the shrinking surplus reflected two reinforcing developments: lower EU exports to the United States and higher U.S. exports to the EU (see the graphic). Immediately after implementation (September-December 2025), EU exports fell by US$11.7 billion (5.7%), while U.S. exports rose by US$19.1 billion (15.6%). In the first five months of 2026, EU exports were US$23.6 billion (9.6%) lower than in the corresponding period of 2024, while U.S. exports increased by US$37.1 billion (24.1%).
Taken together, these results suggest that the Turnberry agreement has been accompanied by a substantial narrowing of the EU's goods trade surplus, driven by both lower European exports in the U.S. market and stronger U.S. sales into the European market.
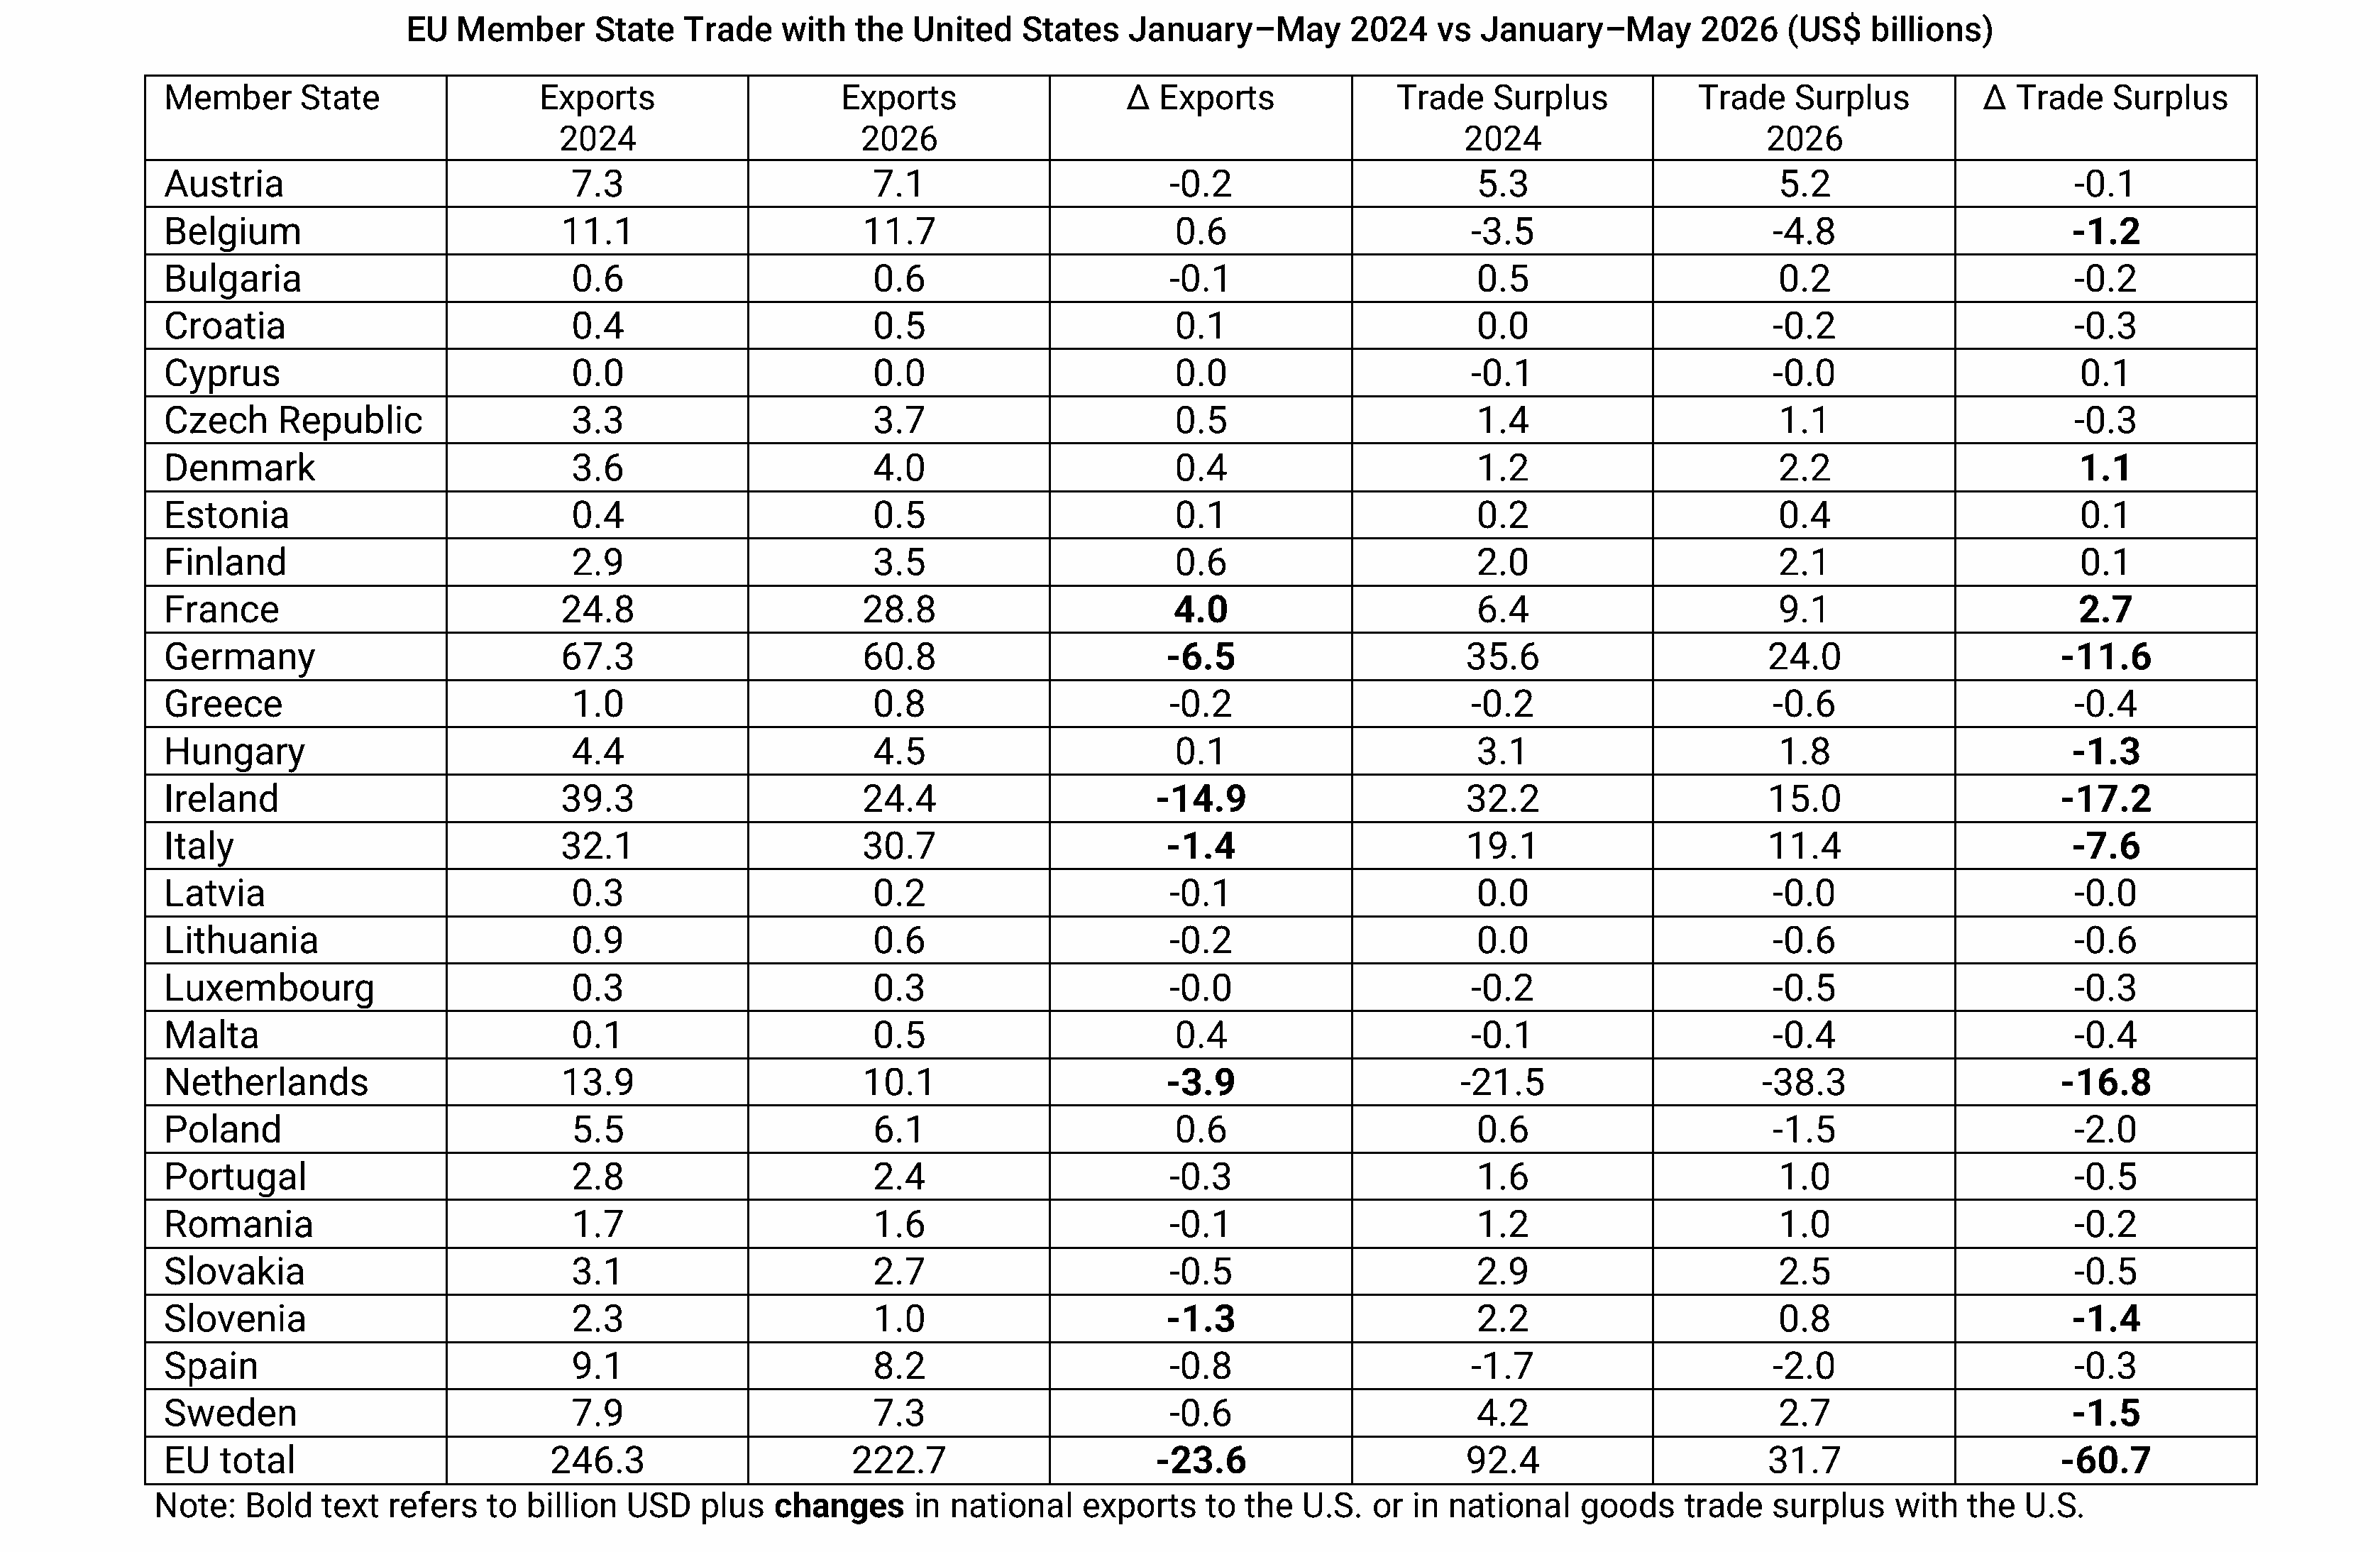
Table 1 reports the change between January-May 2024 and 2026 in each EU member state’s total exports to and goods trade surplus (or deficit) with the United States.
The aggregate decline in the EU's goods trade surplus masks considerable variation across Member States. Between January–May 2024 and the corresponding period of 2026, Ireland's surplus with the United States fell by US$17.2 billion, Germany's by US$11.6 billion and Italy's by US$7.6 billion. The Netherlands' trade deficit widened by US$16.8 billion, although that figure should be interpreted with caution given the country's role as a major logistics and re-export hub. Poland's trade balance deteriorated by US$2.0 billion, while Hungary's surplus declined by US$1.3 billion. By contrast, France's surplus increased by US$2.7 billion, Denmark's by US$1.1 billion, and Finland's by US$0.1 billion, with Estonia also recording a modest improvement. Overall, the adjustment was highly concentrated, with a handful of Member States accounting for the overwhelming majority of the US$60.7 billion contraction in the EU's aggregate goods trade surplus with the United States.
Developments in exports to the U.S. market were similarly uneven. EU exports to the United States fell by US$23.6 billion between January–May 2024 and January–May 2026. Much of this decline was concentrated in a small number of Member States. Ireland's exports fell by US$14.9 billion, Germany's by US$6.5 billion, the Netherlands' by US$3.9 billion and Italy's by US$1.4 billion. By contrast, several Member States expanded their exports despite higher U.S. tariffs. France increased exports by US$4.0 billion, Poland by US$0.6 billion, Finland by US$0.6 billion, Belgium by US$0.6 billion, the Czech Republic by US$0.5 billion, and Denmark by US$0.4 billion. These contrasting experiences reinforce the conclusion that the adjustment to higher U.S. tariffs was highly uneven across the European Union rather than broad-based.
These billion-dollar changes must have affected the financial performance of some firms. To explore this further, I examined the product lines where the biggest changes were witnessed. (For trade analysts, I looked at the changes at the six-digit level of product disaggregation in the UN Harmonized System of goods.)
The US$37.1 billion increase in U.S. exports to the EU between January–May 2024 and January–May 2026 was concentrated in a handful of product categories, led by liquefied natural gas (US$6.7 billion), aircraft (US$5.3 billion), crude petroleum (US$5.0 billion) and refined petroleum products (US$3.2 billion). Together, energy products alone accounted for around 40% of the increase in U.S. exports.
By contrast, the US$23.6 billion decline in EU exports to the United States was concentrated in pharmaceuticals, chemicals and motor vehicles. The largest reductions were in immunological products (US$6.8 billion), medicaments (US$3.4 billion), battery electric vehicles (US$2.1 billion), hormones (US$2.1 billion) and heterocyclic compounds (US$2.0 billion). Passenger cars also recorded a substantial decline of US$1.8 billion.
The experience of these three sectors was far from typical. Of the 4,879 products exported by the European Union to the United States during January–May 2024, 2,300 recorded higher export sales during the corresponding period of 2026. A further 237 product categories saw exports decline by less than 5%. Only 2,342 product categories experienced declines of 5% or more.
Rather than reflecting broad-based changes across every traded sector, the narrowing of the EU's trade surplus was therefore driven by substantial gains in U.S. energy exports and sharp declines in several of the EU's highest-value manufactured exports. The Turnberry deal has not forced an across-the-board retreat of EU exporters from the United States market.
What of those sector-specific purchasing commitments by the EU? Comparing the nine months following implementation of the Turnberry agreement (September 2025–May 2026) with the corresponding period a year earlier, U.S. exports to the EU increased in each of the three sectors highlighted in the agreement.
A basket of U.S. energy products corresponding closely to the wording of the Turnberry agreement—liquefied natural gas, oil and identifiable nuclear-energy products—rose from $53.5 billion during September 2024–May 2025 to $69.0 billion during September 2025–May 2026.[1] This represents an increase of $15.5 billion, or 28.9%. Purchases during September 2025–May 2026 averaged approximately $7.7 billion per month. If the agreement's commitment to procure $750 billion of U.S. energy products is intended to be fulfilled by the end of 2028, the implied purchasing rate is approximately $18.8 billion per month. On this basis, recorded purchases were running at approximately 41% of the pace implied by the agreement.
For AI chips, the broadest relevant customs category—electronic integrated circuits and their parts (HS 8542)—shows EU imports from the United States increasing from $2.0 billion during September 2024–May 2025 to $3.2 billion during September 2025–May 2026, equivalent to approximately $0.36 billion per month.[2] Because these HS6 categories include many semiconductors that are not AI chips, this figure represents an upper bound on EU imports of AI chips from the United States. If the agreement's $40 billion commitment is intended to be fulfilled by the end of 2028, then even this upper bound falls well short of the implied monthly pace, indicating that AI-chip purchases are not on track.
Finally, identifiable exports of arms and ammunition increased, and even under the deliberately generous assumption that all Chapter 88 aircraft exports represent military procurement, the resulting increase remains modest relative to the agreement's commitment to substantially increase purchases of U.S. defence equipment.
The Turnberry deal has seen a marked and accelerating reduction in the EU goods trade surplus with the United States. Much of the adjustment is concentrated in a small number of sectors, implying that large numbers of EU exporters have maintained their presence in the U.S. market and either accepted lower profit margins or, more likely, were confident of passing along the higher tariffs to U.S. buyers in the form of higher prices. (Sadly, customs data cannot reveal which of these two explanations had greater relevance.)
Whether the overall reduction in EU trade surplus witnessed since Turnberry satisfies the Trump Administration remains to be seen. The EU’s specific purchase commitments, however, are not on track and this may be a source of contention. Given recent US criticism of the EU’s exercise of its regulatory autonomy, the omens are not good. Soon the EU may find itself in trade confrontations with China[3] and the United States.
The Turnberry agreement demonstrated that the European Union could maintain unity despite significant differences in Member States in their trading relationships with the United States. Whether that solidarity can be sustained as geopolitical rivalry intensifies and future disruption affects Member States in different ways will be one of the defining questions for EU trade policy in the years ahead.
Simon J. Evenett is Professor of Geopolitics & Strategy, IMD Business School, Lausanne, Switzerland; Co-Chair, Trade & Investment Council, World Economic Forum; Founder, St. Gallen Endowment for Prosperity Through Trade, the institutional home of the few remaining independent trackers of digital, trade, industrial, subsidy and investment policy.
This calculation was based on the following HS codes: 270900, 271012, 271019, 271020, 271091, 271099, 271111, 284410, 284420, 284430, 284441, 284442, 284443, 284444, and 840130.
This calculation was conducted using U.S. export data for the following HS codes: 854231, 854232, 854233, 854239, and 854290.
If we are to believe the statements of EU policymakers, China’s growing goods trade surplus is the lightning rod. Senior European Union policymakers have declared that measures to reduce this surplus must be taken by October 2026.