While headlines often focus on tariffs and big-ticket subsidies, the quieter transformation of G20 commercial policy continues through instruments like services restrictions, targeted industrial subsidies and coercive trade tactics. This data-rich snapshot tracks how G20 governments are recalibrating trade policy tools in response to strategic competition, domestic reindustrialisation, and geoeconomic fragmentation.
Authors
Global Trade Alert
Date Published
07 Oct 2025
Related Topics:

Why Bother Tracking the Trade Policies of G20 Members?
The rationale for the G20 Trade Policy Factbook 2025 Edition
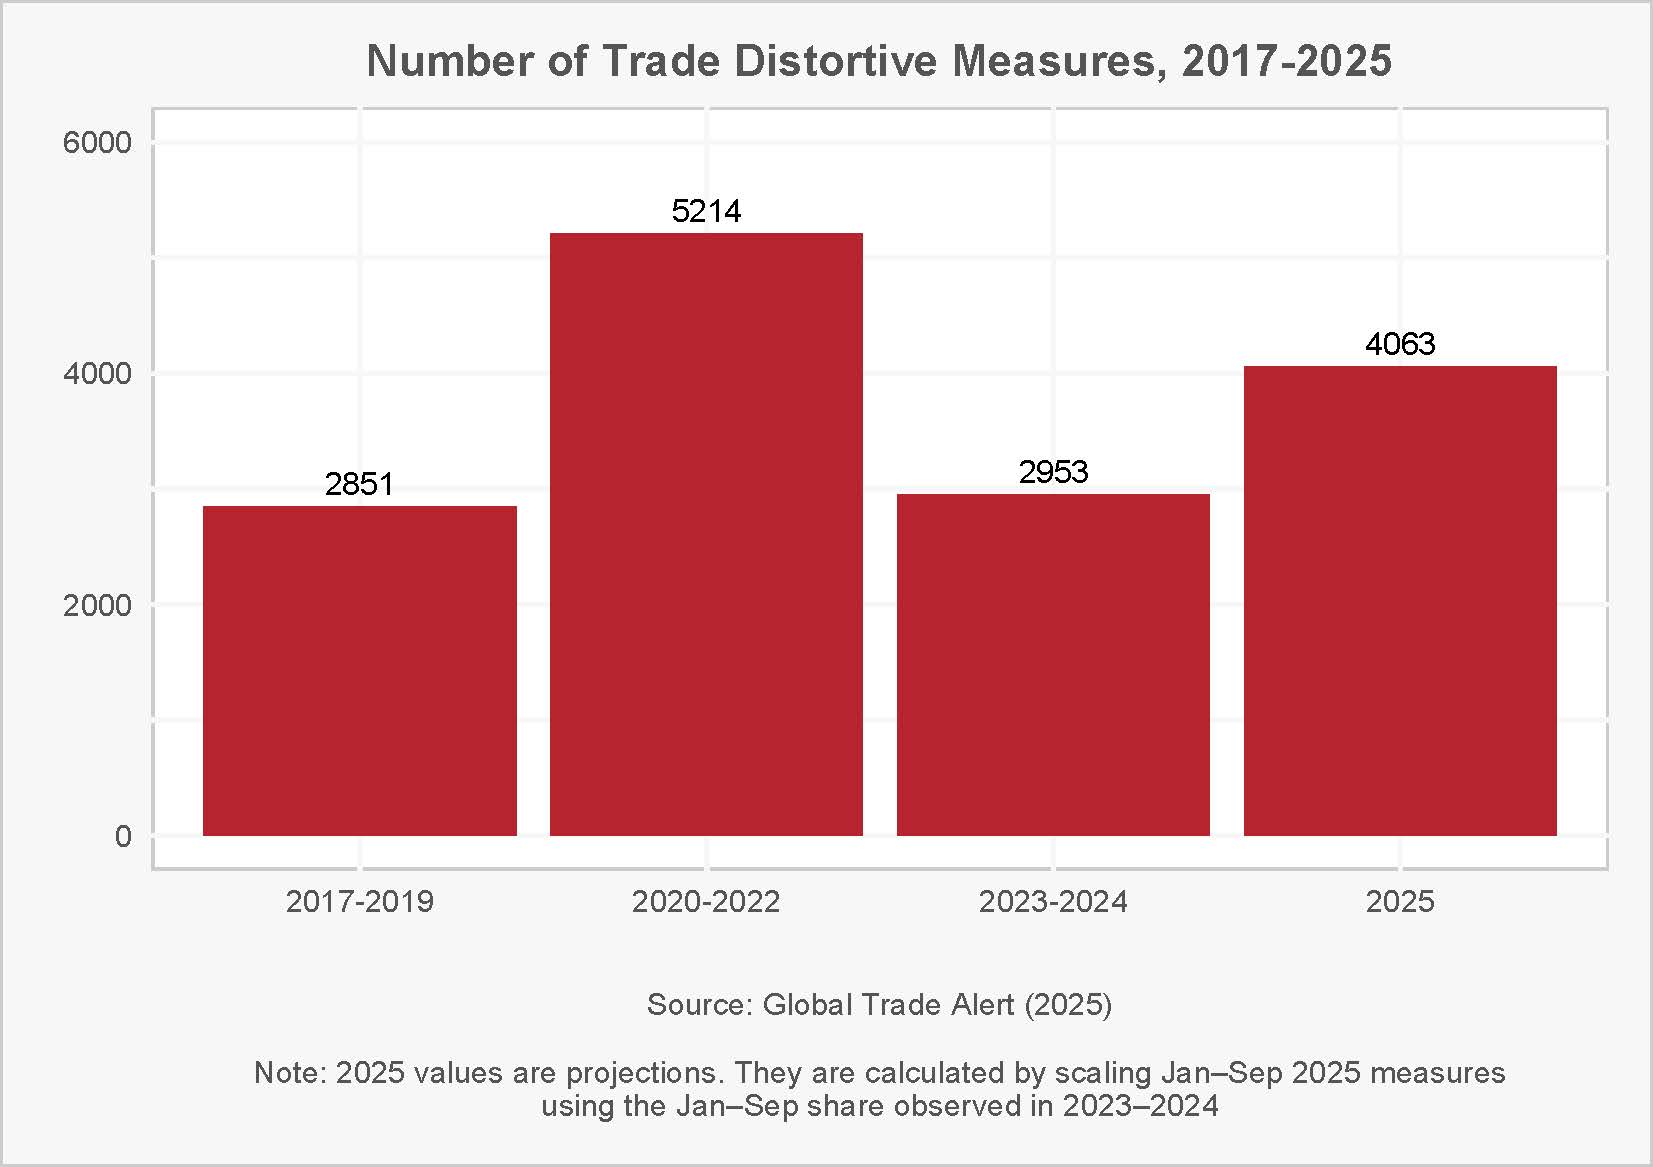
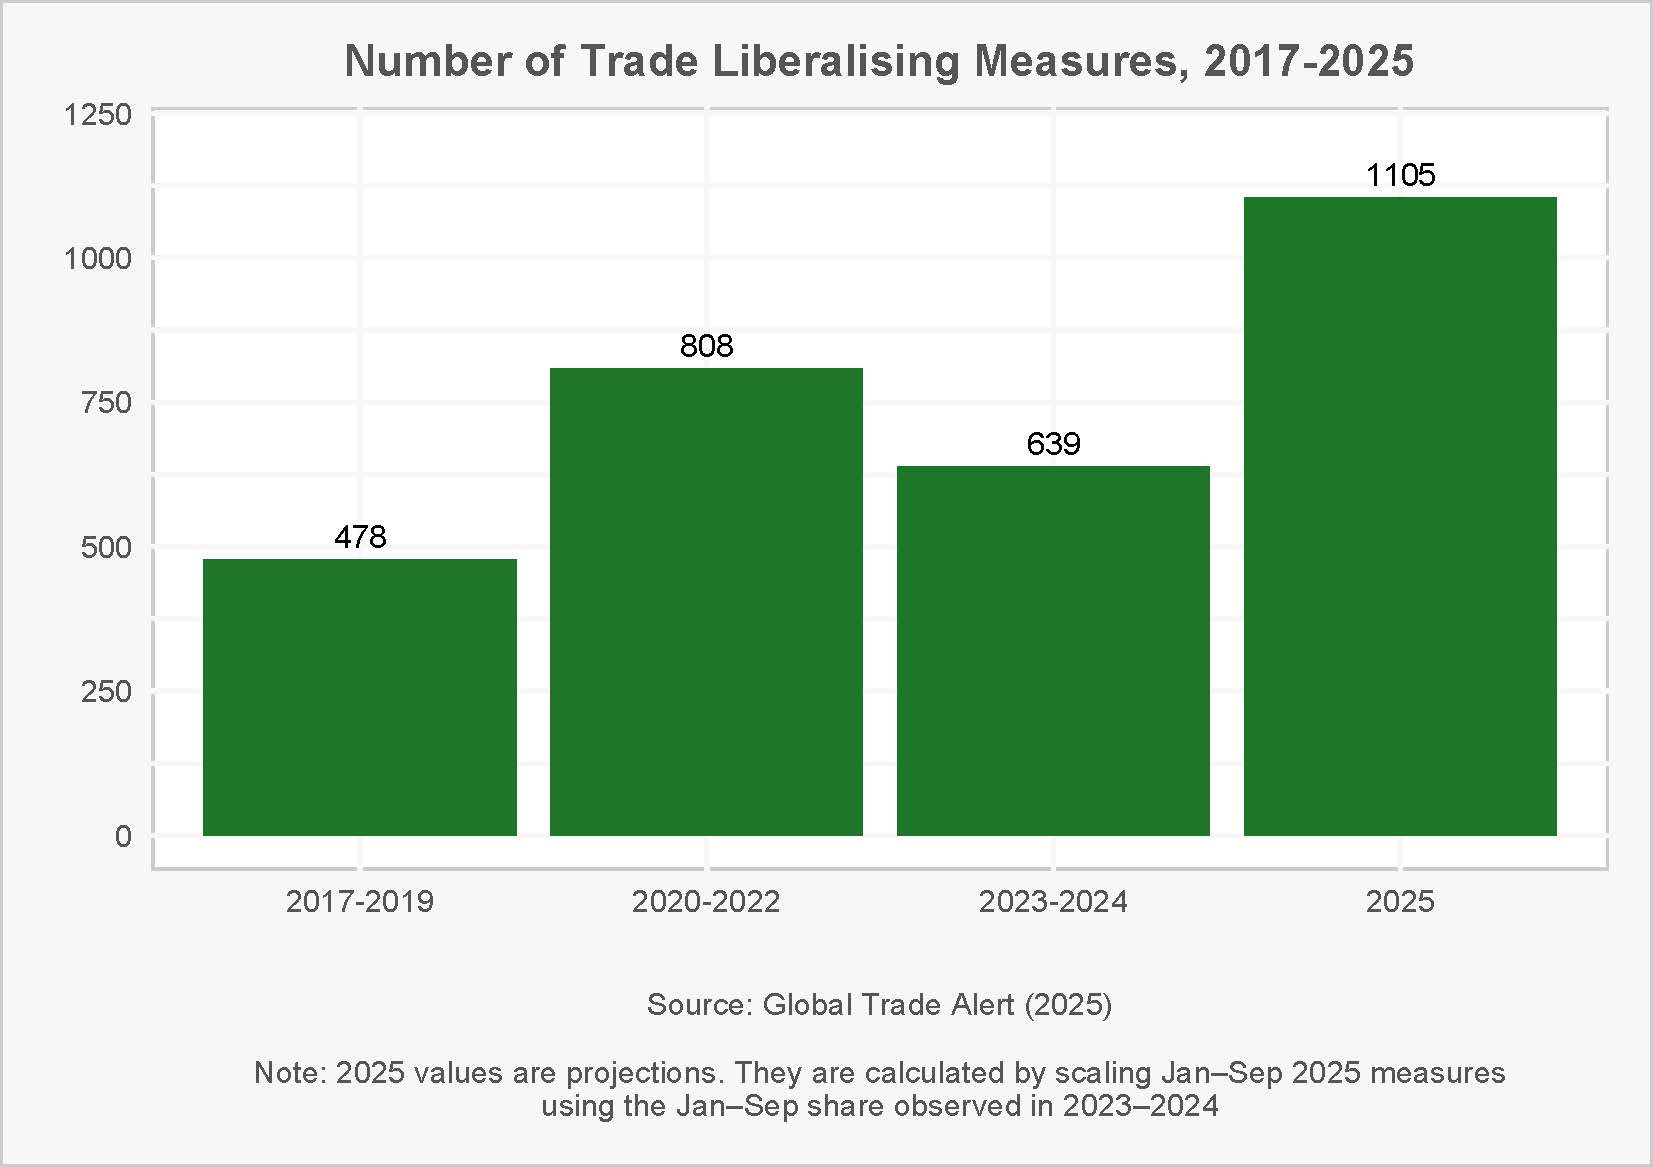
The trade policy environment in 2025 is unsettled, fast-moving, and unusually consequential. Our Factbook shows that the volume of G20 trade interventions in 2025 is on track to exceed 2023–24, even if it remains below the COVID-era peak—evidence that policy activism has not eased. Projections are constructed from year-to-date counts scaled to past reporting patterns to ensure comparability.
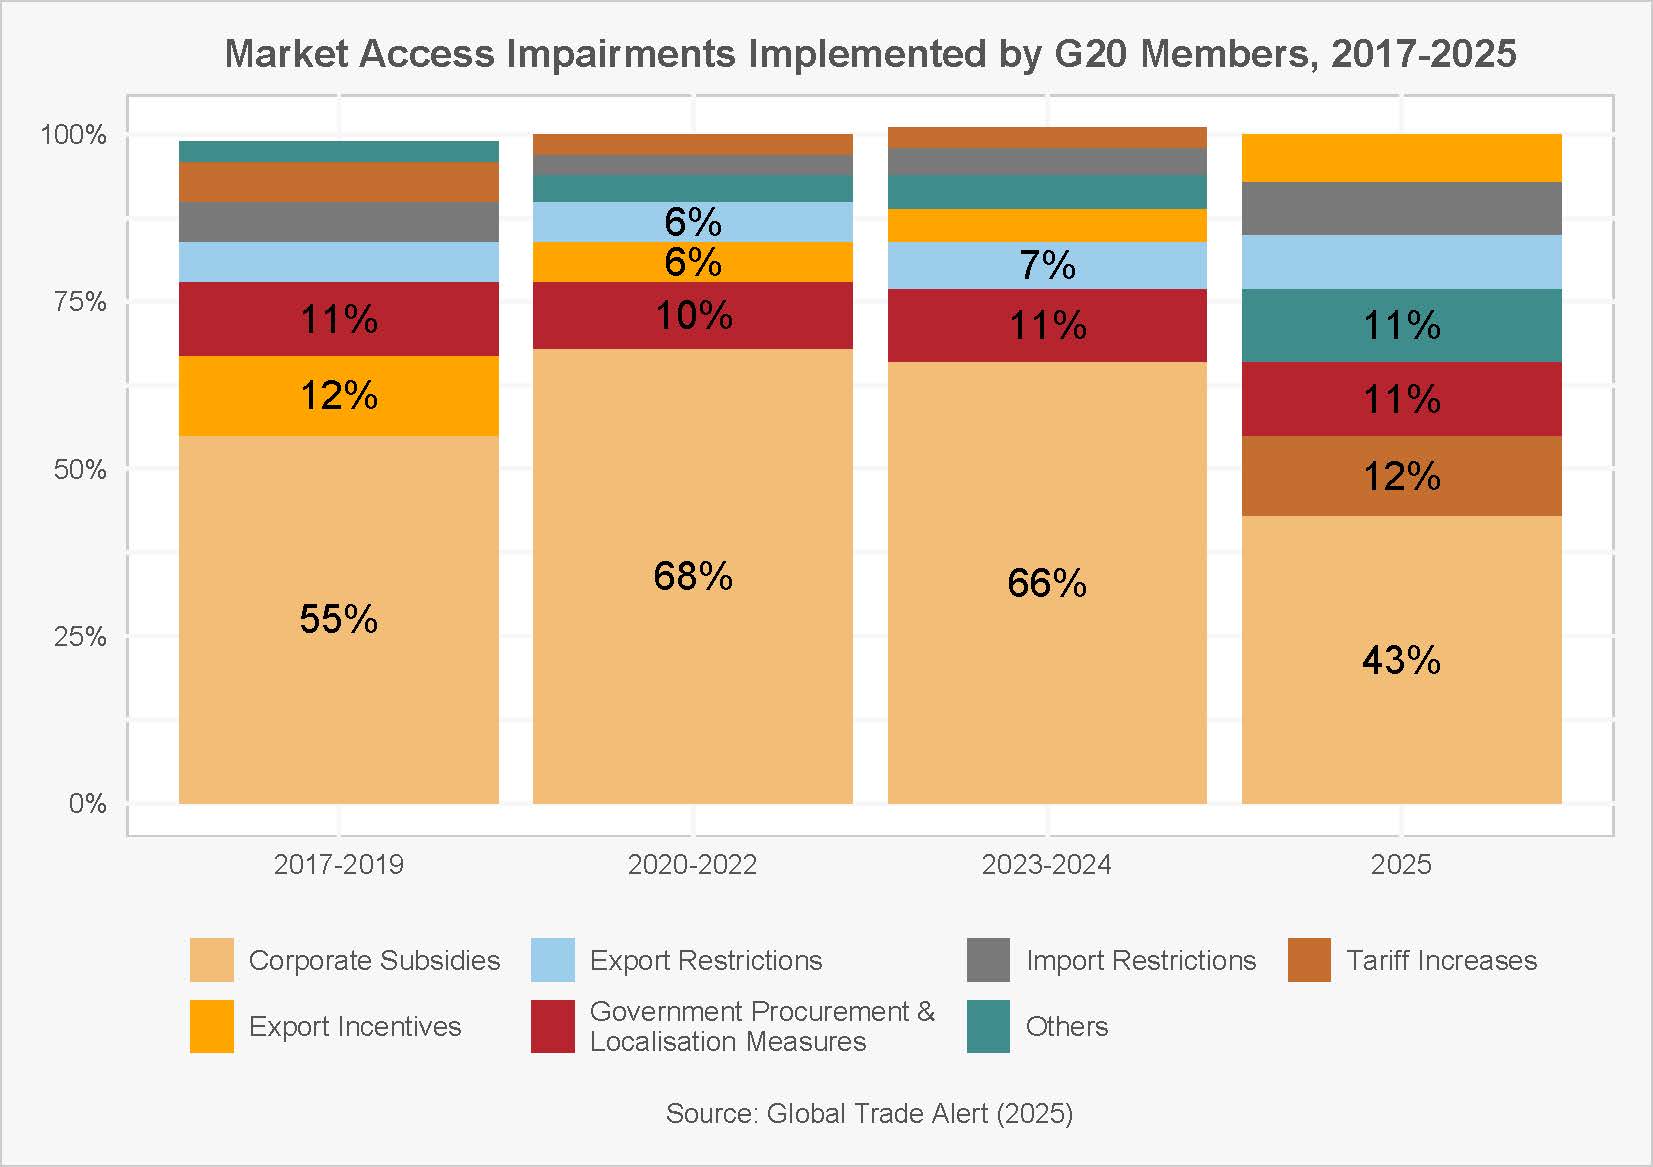
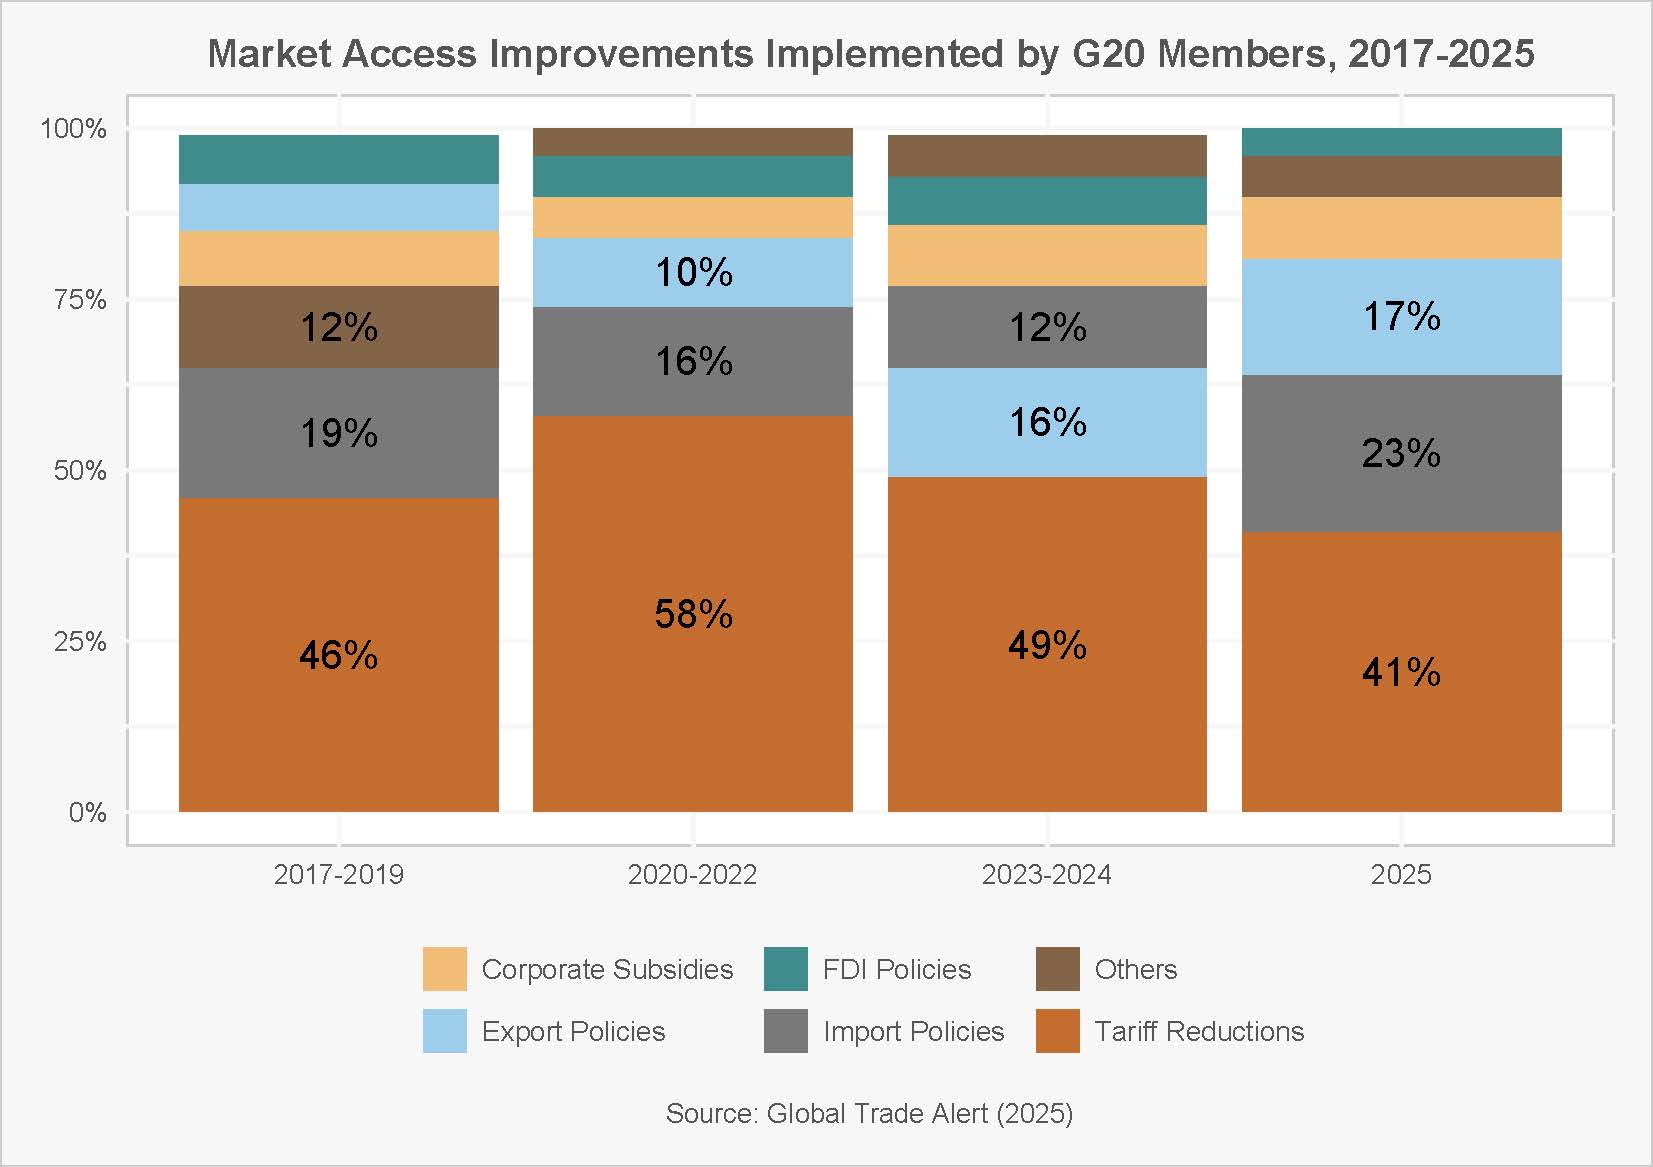
What’s changed this year is the mix. During 2020–2024, corporate subsidies dominated market-access frictions. In 2025 tariff increases re-emerge as a prominent barrier, while liberalisation increasingly arrives through targeted import and export policy changes rather than across-the-board tariff cuts.
At the same time, policy stances are diverging across members: some economies combine sizeable restrictiveness with notable liberalisation, underscoring the need to track both risks and openings rather than assume a single G20 narrative. Our measurement links each intervention to HS-6 codes and separates distortive from liberalising actions in force as of late-2025.
Security and geoeconomics now frame a growing share of actions. Measures justified on national-security grounds cover rising shares of trade, with the United States showing higher coverage on both imports and exports, while China’s controls skew toward exports. These indicators capture incidence (how much trade is covered), not the intensity of each measure—another reason continuous monitoring matters.
Relatedly, export restrictions on high-tech and dual-use items are extensive among leading suppliers and often focus on geopolitical rivals—a pattern that reshapes supply-chain risk for firms and governments alike.
Despite the rhetoric of “de-risking,” the intra-G20 map of trade partners has changed only modestly since 2019, while transatlantic FDI paths have diverged—rising in the U.S., stalling in the EU. These facts temper claims of wholesale realignment and highlight where structural shifts really are (investment) versus where they are not (merchandise trade destinations).
Services add another layer: between 2019 and 2023, Telecom/IT & Information gains share across many G20 markets while Travel’s share remains lower, a persistent post-pandemic imprint. In digitally delivered trade, computer services are the main winner, sharpening competition in intangible-intensive sectors.
Why this Factbook now? Because 2025 combines: (i) more interventions than last year; (ii) a pivot back to tariffs alongside evolving liberalisation channels; (iii) wider reliance on security-framed tools; (iv) limited trade-destination reconfiguration but sharper investment divergence; and (v) a services mix tilting further toward digital. These dynamics raise compliance costs, alter market-entry math, and reshape exposure for firms and policymakers. Tracking them with comparable metrics—incidence, coverage, and composition—helps anticipate where barriers (or openings) will appear next.
To guide readers through these shifts, the Factbook is organised into six parts covering commercial policy, geoeconomics, coercive measures, industrial policy & subsidies, and services trade, with concise methods notes so users can interpret each figure with confidence.
Developments in G20 Commercial Policy
Figure 1. Trade Distortions in 2025 Exceed 2023–24 but Fall Short of COVID-Era Highs
How was Figure 1 prepared?
For each year from 2017 to 2024, the Global Trade Alert database was used to record the total number of G20 policy interventions that either disadvantaged the competitive position of foreign companies in local markets (shown in the figure as “distortive” interventions) or liberalised cross-border trade and improved the competitiveness of foreign firms. Only EU interventions affecting trade with non-EU partners are included.
For 2025, the figure presents projected totals rather than observed ones. Projection was necessary because data were only available for interventions recorded up to September 30, 2025. To ensure comparability with earlier years, the Jan–Sep counts were scaled using the ratio of Jan–Sep to full-year reporting observed in 2023–2024, calculated separately for distortive and liberalising interventions.
Figure 2. In 2025, Tariff Increases Re-Emerge as Key Market Access Barriers, While Import and Export Liberalisation Gains Ground
How was Figure 2 prepared?
The upper panel uses Global Trade Alert data on market-access–reducing policy interventions adopted by G20 members from 2017 to 2025. We identified the most common measure types and plotted them in a 100% stacked bar chart to show how the mix of distortive interventions changed over time.
During the pandemic years (2020–2022), corporate subsidies dominated G20 market-access restrictions and remained prominent through 2023–2024. In 2025, however, tariff increases re-emerged as a notable source of impairment, alongside persistent government-procurement rules and localisation requirements. Corporate subsidies still account for a large share, but their dominance has declined compared with earlier years.
Note that “corporate subsidies” here refers only to subsidies benefiting commercial firms. It excludes non-commercial transfers—such as intergovernmental aid, welfare payments to individuals, and international development assistance—which the GTA database does not track.
The lower panel draws on the same source to show market-access–improving interventions. As in earlier periods, tariff reductions remain the single largest category of liberalising measures. Yet in 2025 their relative importance fell compared with 2017–2019 and 2020–2022. Instead, liberalisation of import and export policies grew in significance, indicating a shift in the composition of G20 trade-opening measures. Tariff cuts still matter, but governments are increasingly turning to other instruments to improve market access.
Figure 3. Wide Divergence in G20 Trade Policy: High Distortions Alongside Significant Liberalisation in 2025
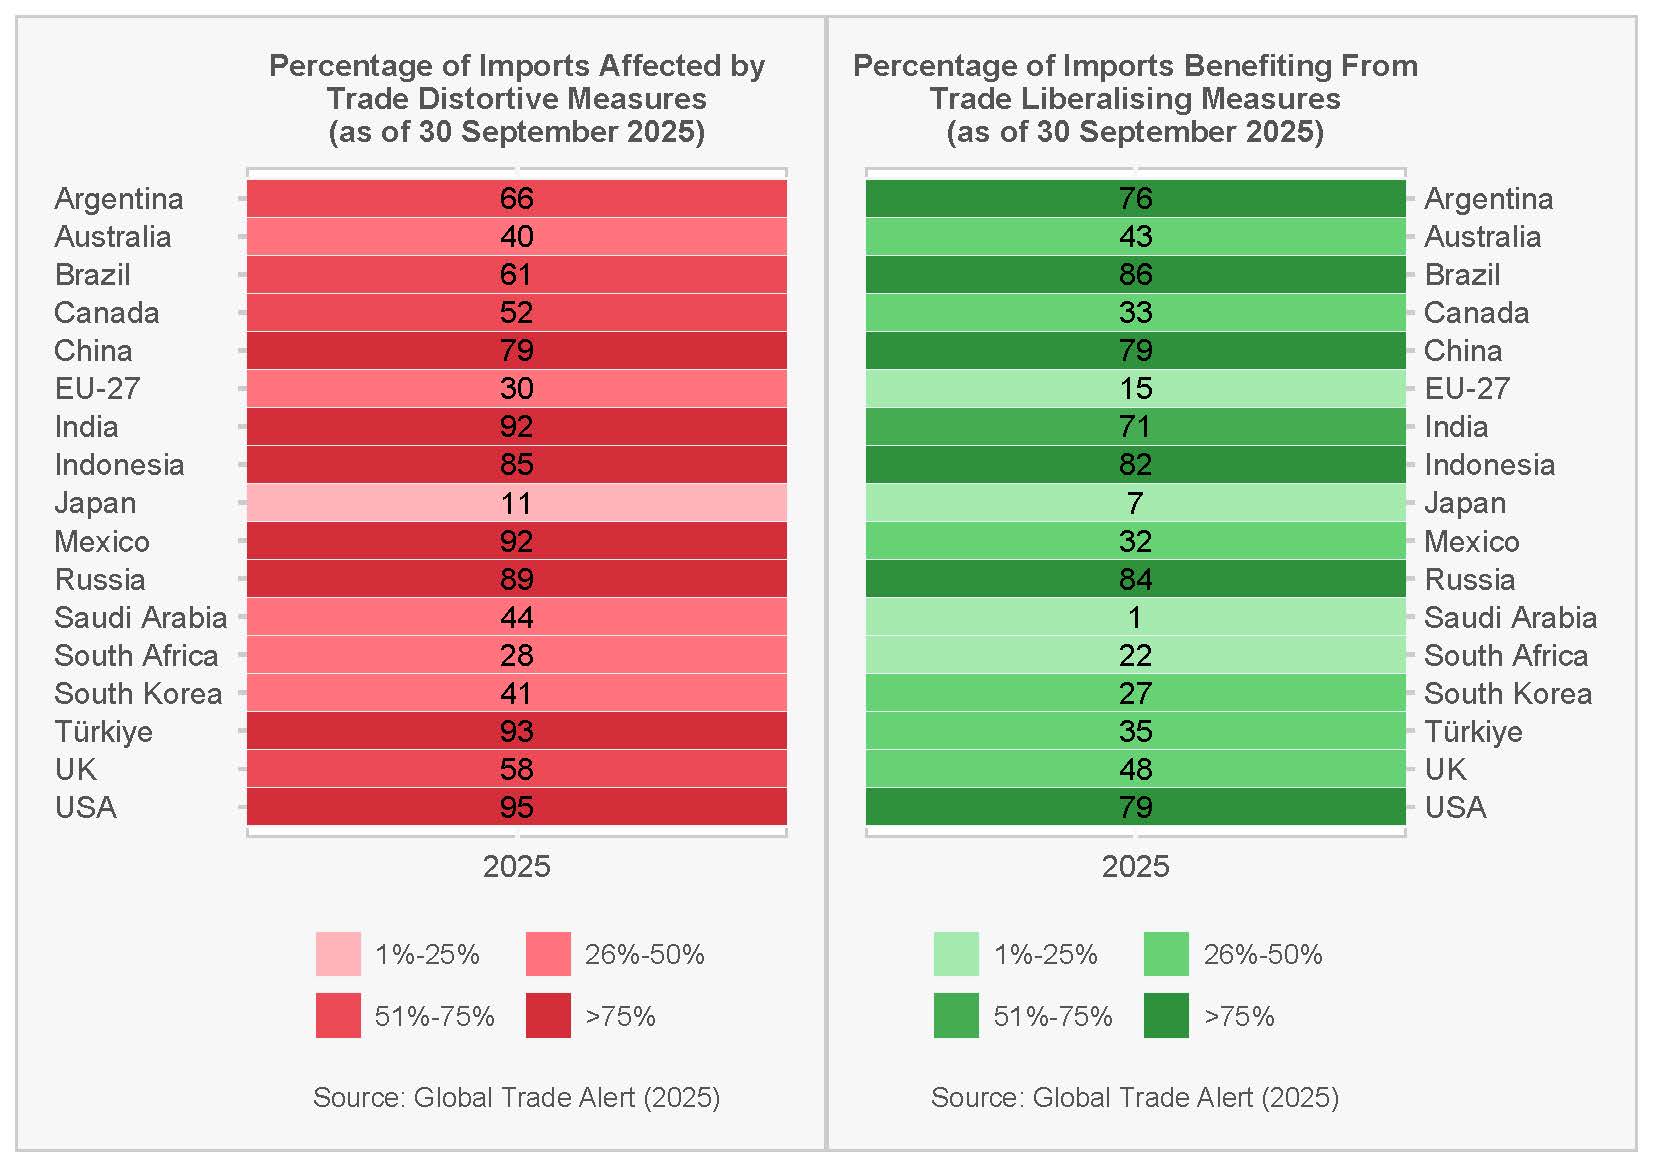
How was Figure 3 prepared?
We assembled all G20 commercial policy measures affecting goods imports that were in force as of September 30, 2025. Each measure is classified as either market-access–restricting (“distortive interventions”) or market-access–enhancing (“liberalising interventions”) and mapped to six-digit HS 2022 product codes.
We then calculated the value of G20 goods imports exposed to these measures. Interventions that affect exports—such as export taxes, quotas, bans, or incentives—are excluded from the totals. The analysis uses 2023 trade flow data from BACI (CEPII). For the European Union, we include only measures that apply to extra-EU trade.
Intra-G20 Geoeconomics
Figure 4. Weaponizing Trade Flows: U.S. Coverage Surges Across Imports & Exports, China’s Controls Skew to Exports
How was Figure 4 prepared?
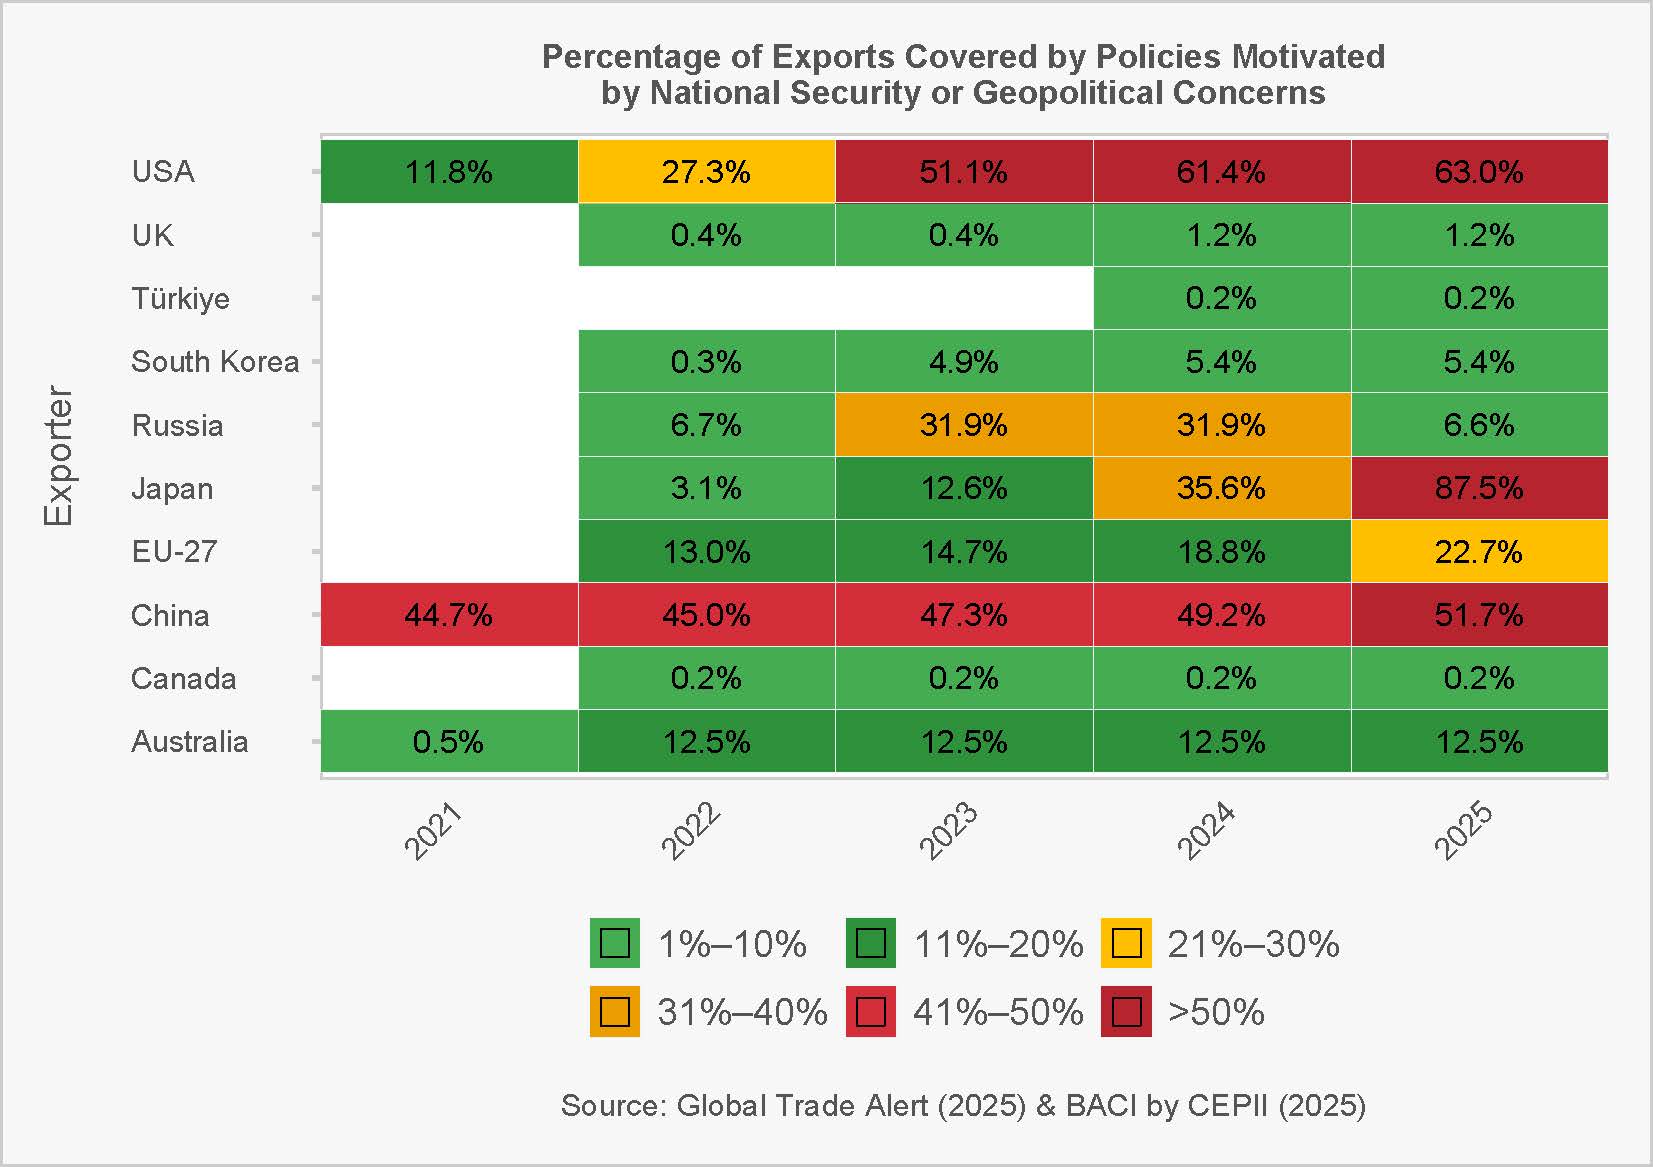
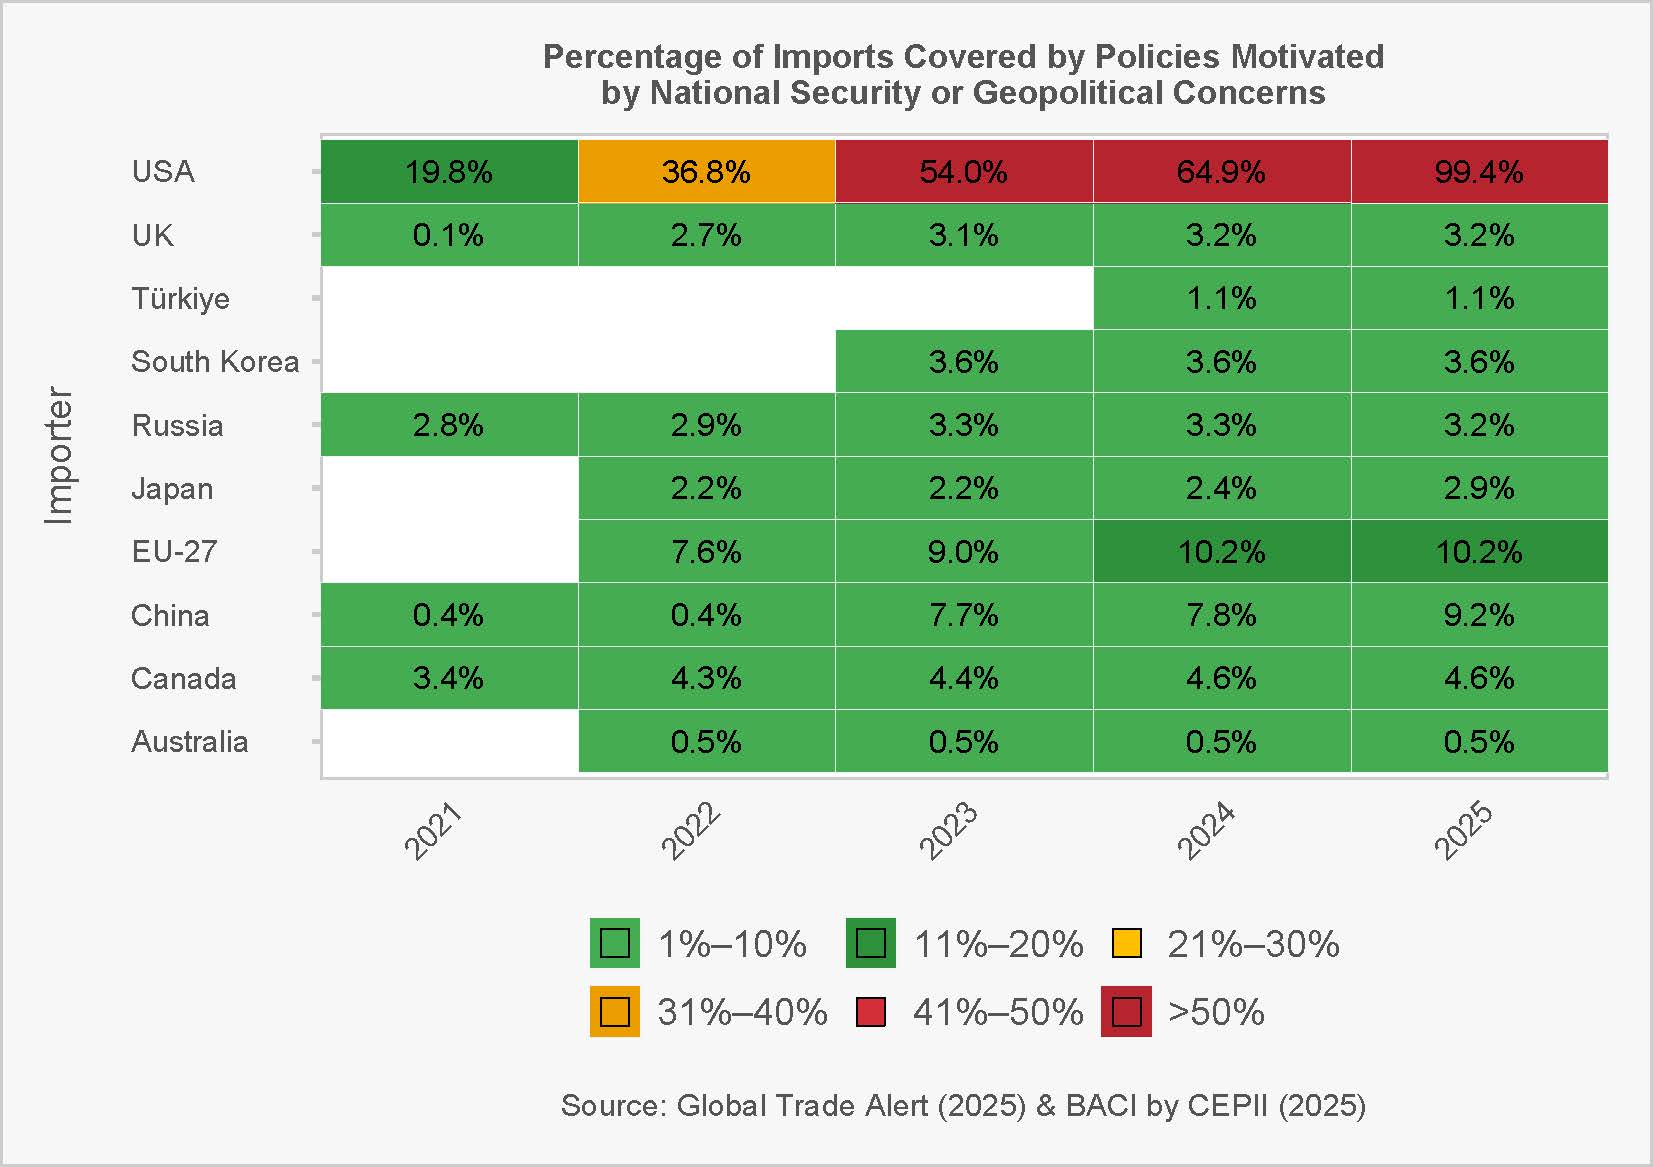
We start from the Global Trade Alert (GTA) database and select all the measures in which the stated justification is national security or broader geopolitical concerns. We then map these measures to BACI/CEPII trade data to estimate the percentage of each country’s imports and exports covered in a given year.
Construction (conservative, year-end stock):
- A measure counts for year t only if it is in force on 31 December of year t (measures lifted before year-end are not counted; measures introduced late in the year are counted if active at year-end).
- Measures are mapped to HS product lines and any country targeting indicated in GTA, then matched to same-year BACI values.
- For each reporter and year, coverage is the trade-weighted union of affected product–partner cells (a cell hit by multiple measures counts once; coverage is capped at 100%).
- Results are shown for imports (share of a country’s inbound goods affected) and exports (share of outbound goods affected). EU-27 is treated as a single reporter.
- What this shows—and what it doesn’t:
- The metric captures incidence (what fraction of trade is covered), not the intensity or restrictiveness of individual measures.
- Services, licensing carve-outs, and compliance exemptions are not observed; the figures reflect merchandise trade only and may lag recent policy changes.
- This approach highlights which members most extensively frame and implement trade actions under security or geopolitical rationales, and how that coverage evolves over time.
Figure 5. Minimal intra-G20 trade reconfiguration since 2019
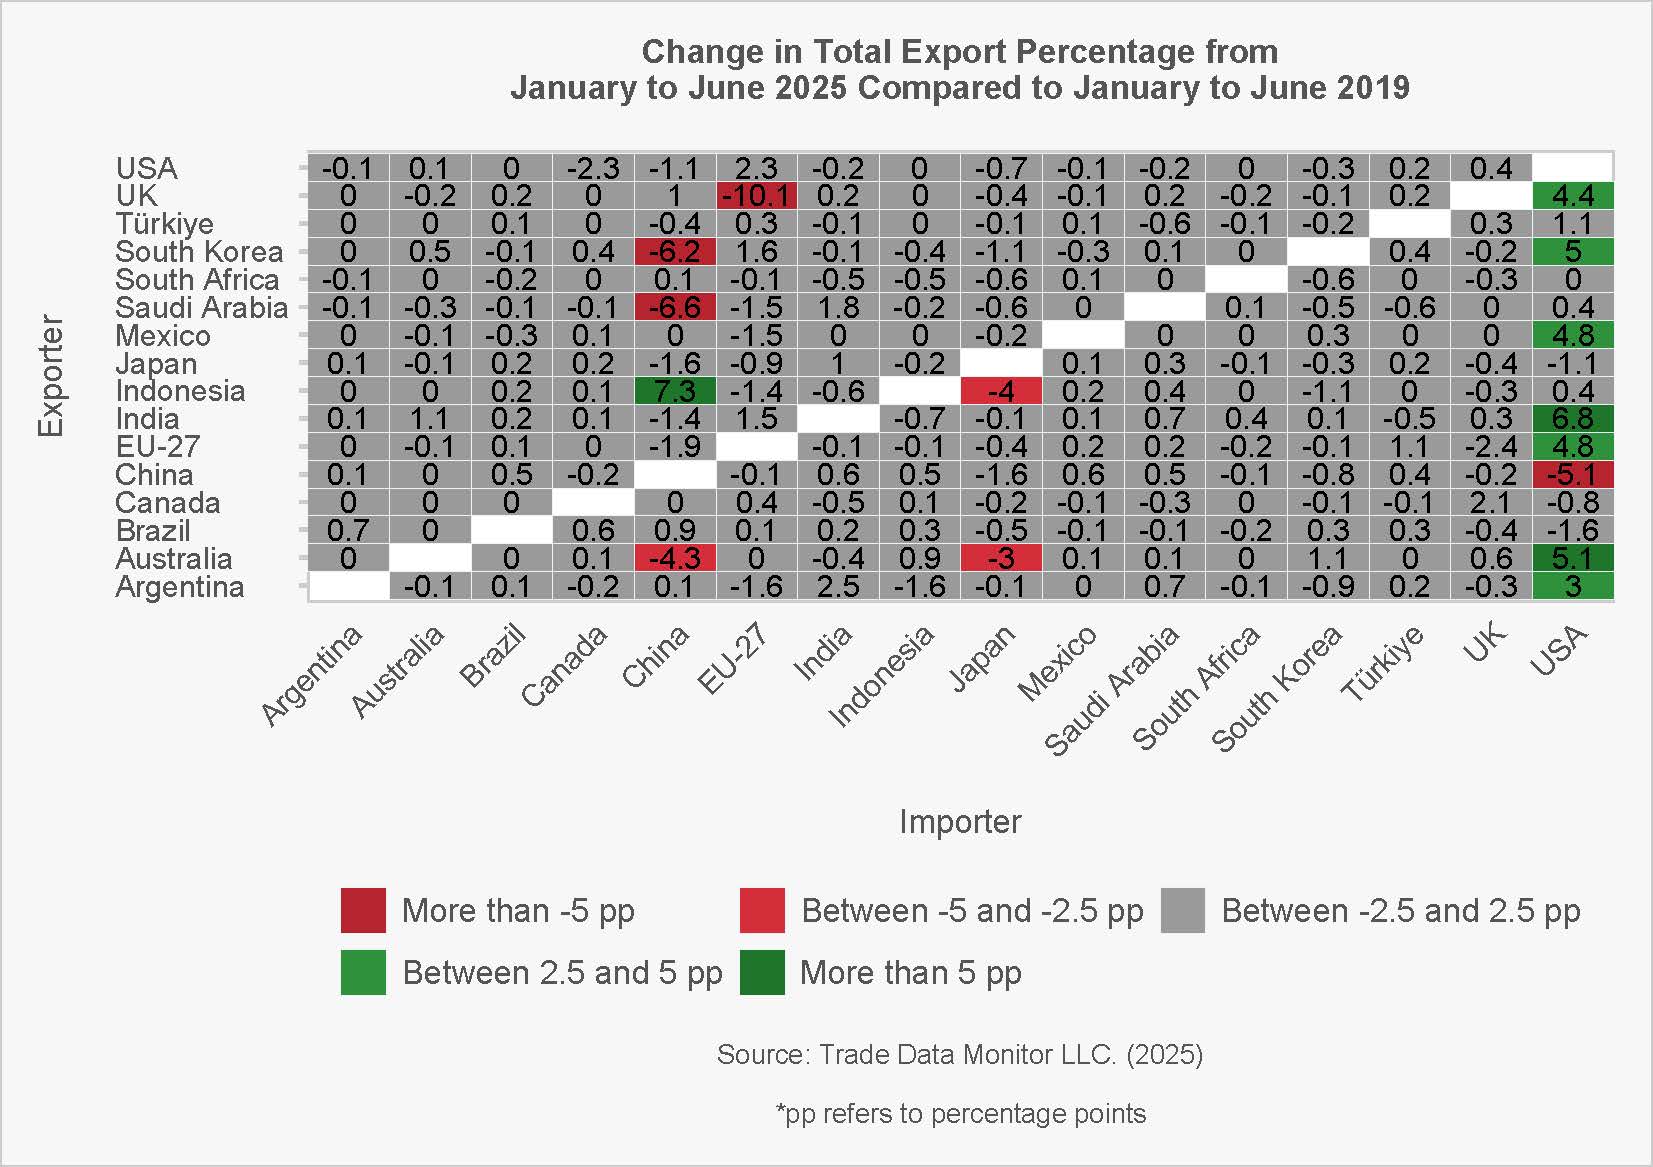
How was Figure 5 prepared?
We compare intra-G20 trade flows for January–June 2019 with January–June 2025 using Trade Data Monitor (TDM) data. For each importer and period, we compute the exporter’s percentage of its total exports. We then take the difference between 2025 and 2019 to measure how that export percentage changed over time. A positive value means the exporter directs a larger share of its total exports to that importer in 2025 than in 2019. Russia is excluded because TDM reports Russian exports only through January 2022.
Figure 6. Transatlantic FDI Divergence: US Surge, EU Stall (2017–2024)
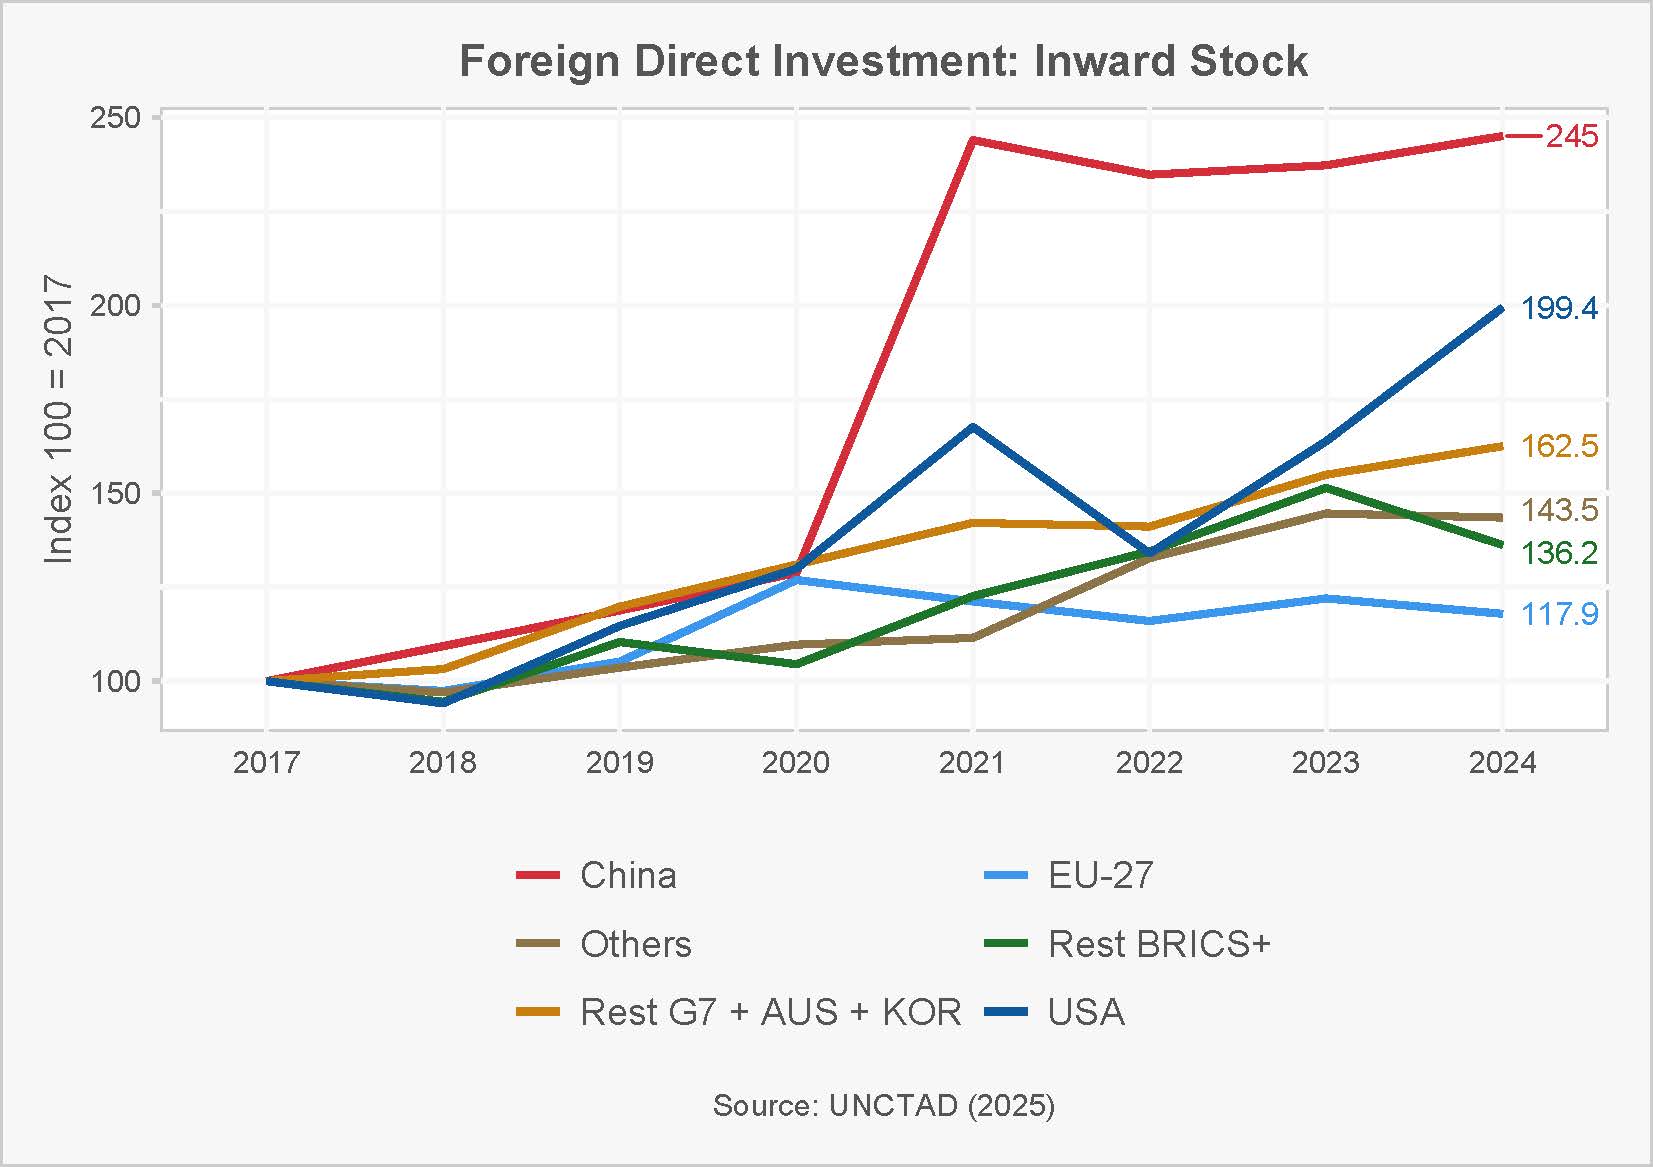
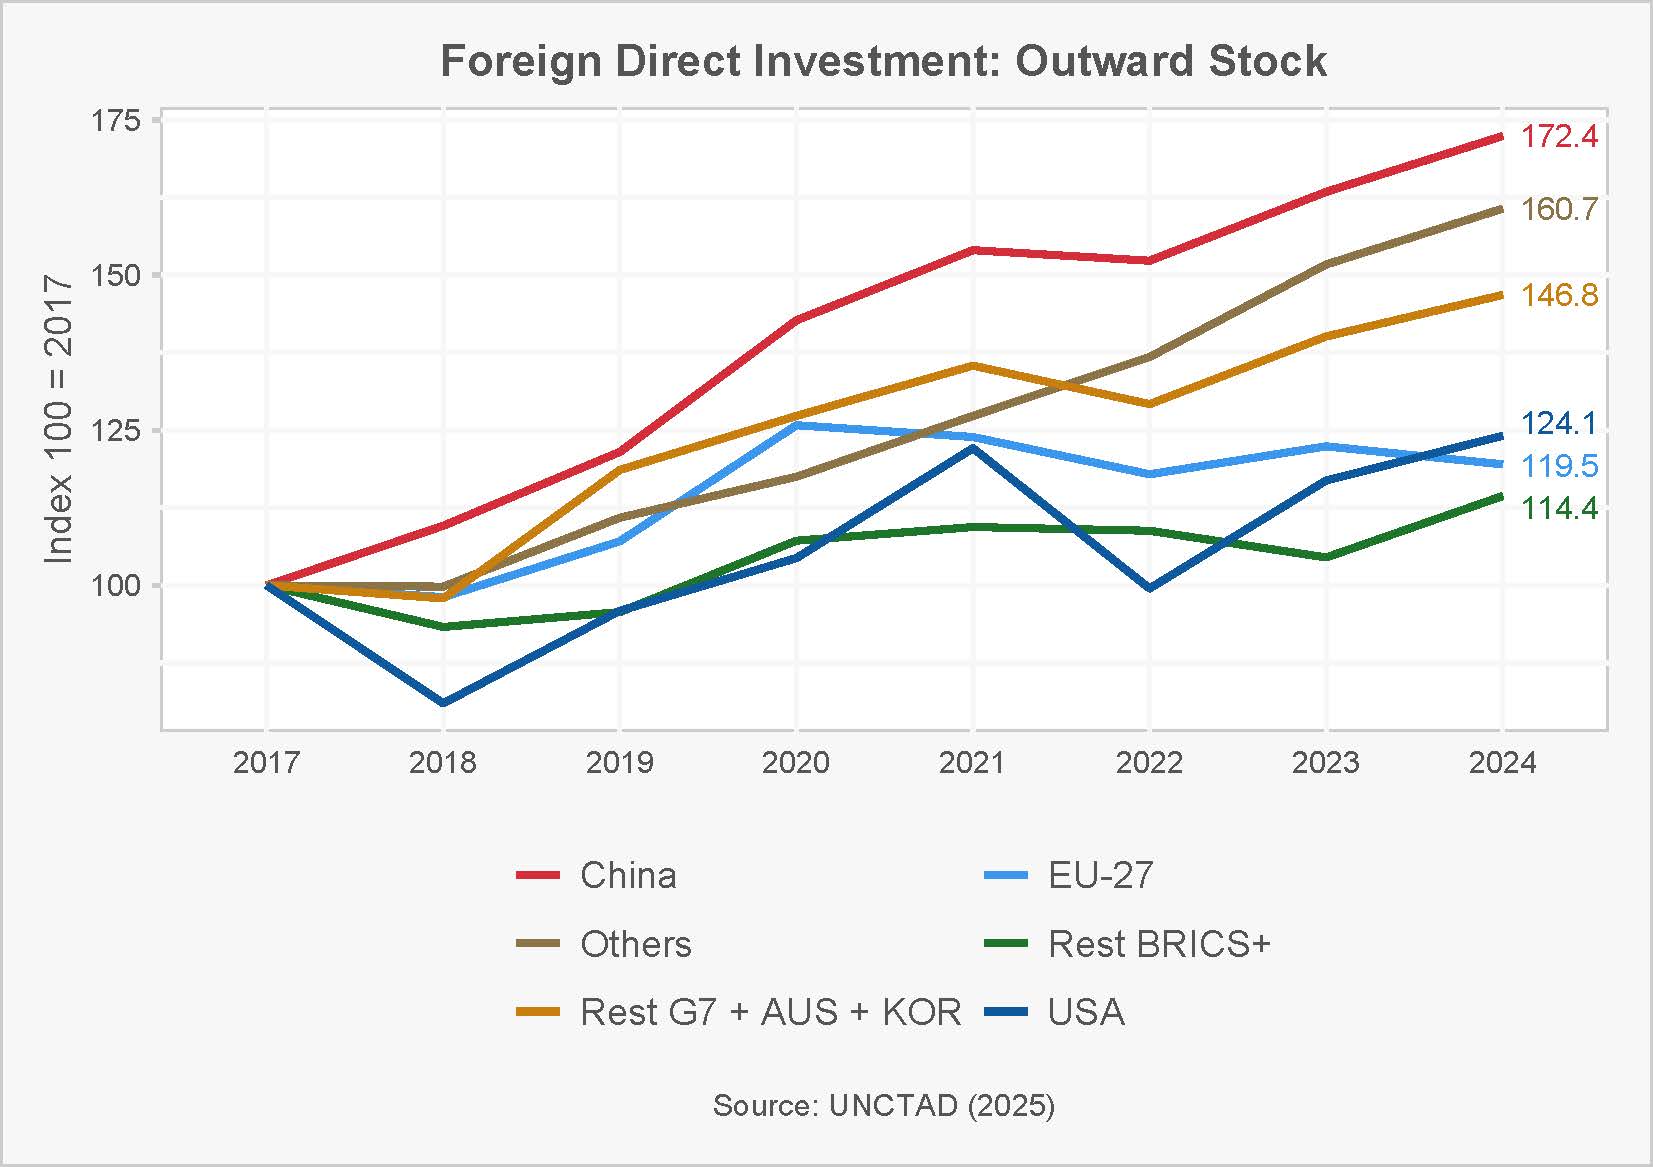
How was Figure 6 prepared?
We used UNCTAD’s Foreign direct investment: Inward and outward flows and stock (annual) dataset to extract FDI stock series for G20 economies from 2017–2024 in current USD. We indexed each country’s 2017 value to 100 and plotted the indexed paths through 2024 (inward and outward series separately).
Since 2020, trajectories have diverged. China’s inward and outward positions grow much faster than those of other blocs. The United States shows the largest cyclical swings, especially on the inward side. The EU-27 records the weakest cumulative growth in both directions. By contrast, Others and Rest G7 + AUS + KOR rise steadily, reflecting broad, incremental accumulation of FDI stocks.
G20 Coercive Trade Measures
Figure 7. Leading Exporters of High-Tech and Dual-Use Items Tend to Impose a Large Number of Export Restrictions, With a Greater Focus on Geopolitical Rivals.
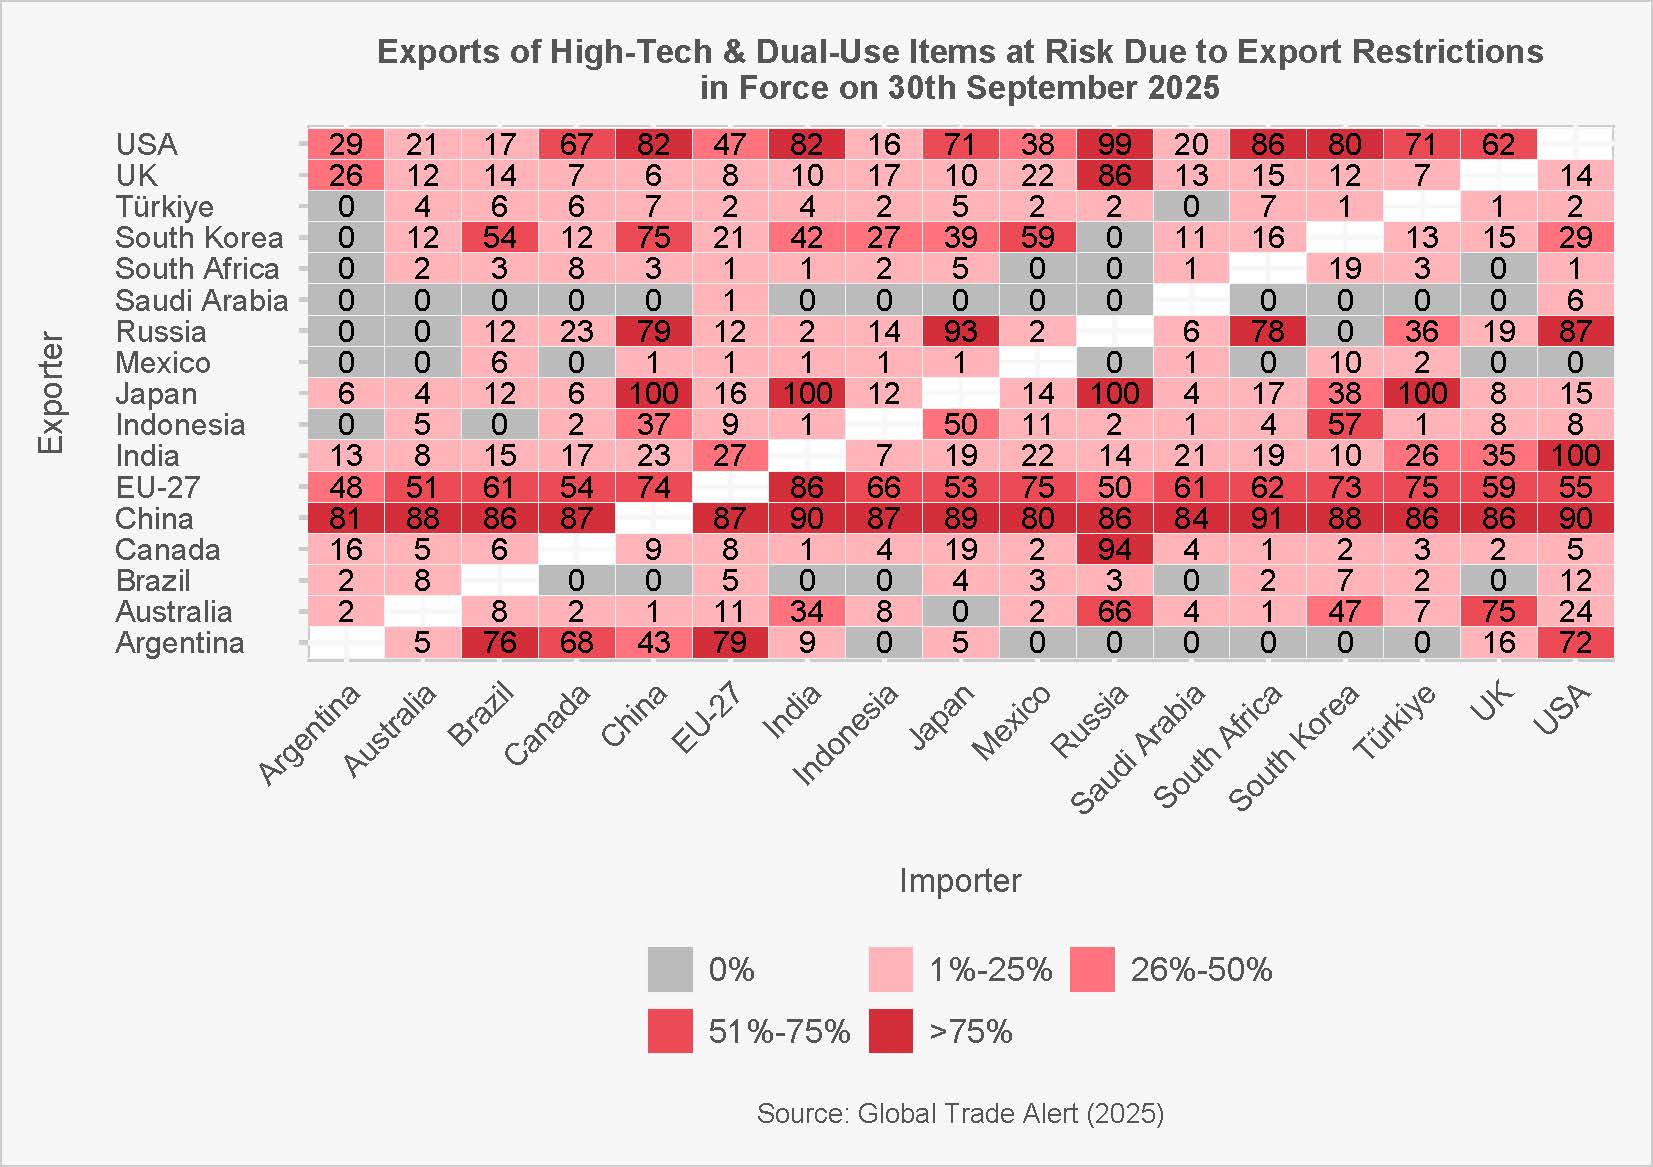
How was Figure 7 prepared?
We compiled measures on export restrictions—including export barriers and limits on outward FDI—targeting dual-use items, advanced technologies, and priority products such as tools and machinery used to produce advanced semiconductors, military equipment, and quantum computers. The dataset covers actions taken by G20 members since 2009 that remained in force as of 30 September 2025. For each G20 member, we estimate the percentage of its own exports affected by its own export barriers.
To limit pandemic-related distortions, we use 2023 trade-flow data from BACI (CEPII). For the European Union, we include only measures that apply to extra-EU trade.
Example: About 90% of China’s total exports of dual-use and high-tech goods to the United States are subject to China’s own trade-distorting export restrictions.
Figure 8. Steady Market Closure: Growing Protection From Foreign Competition
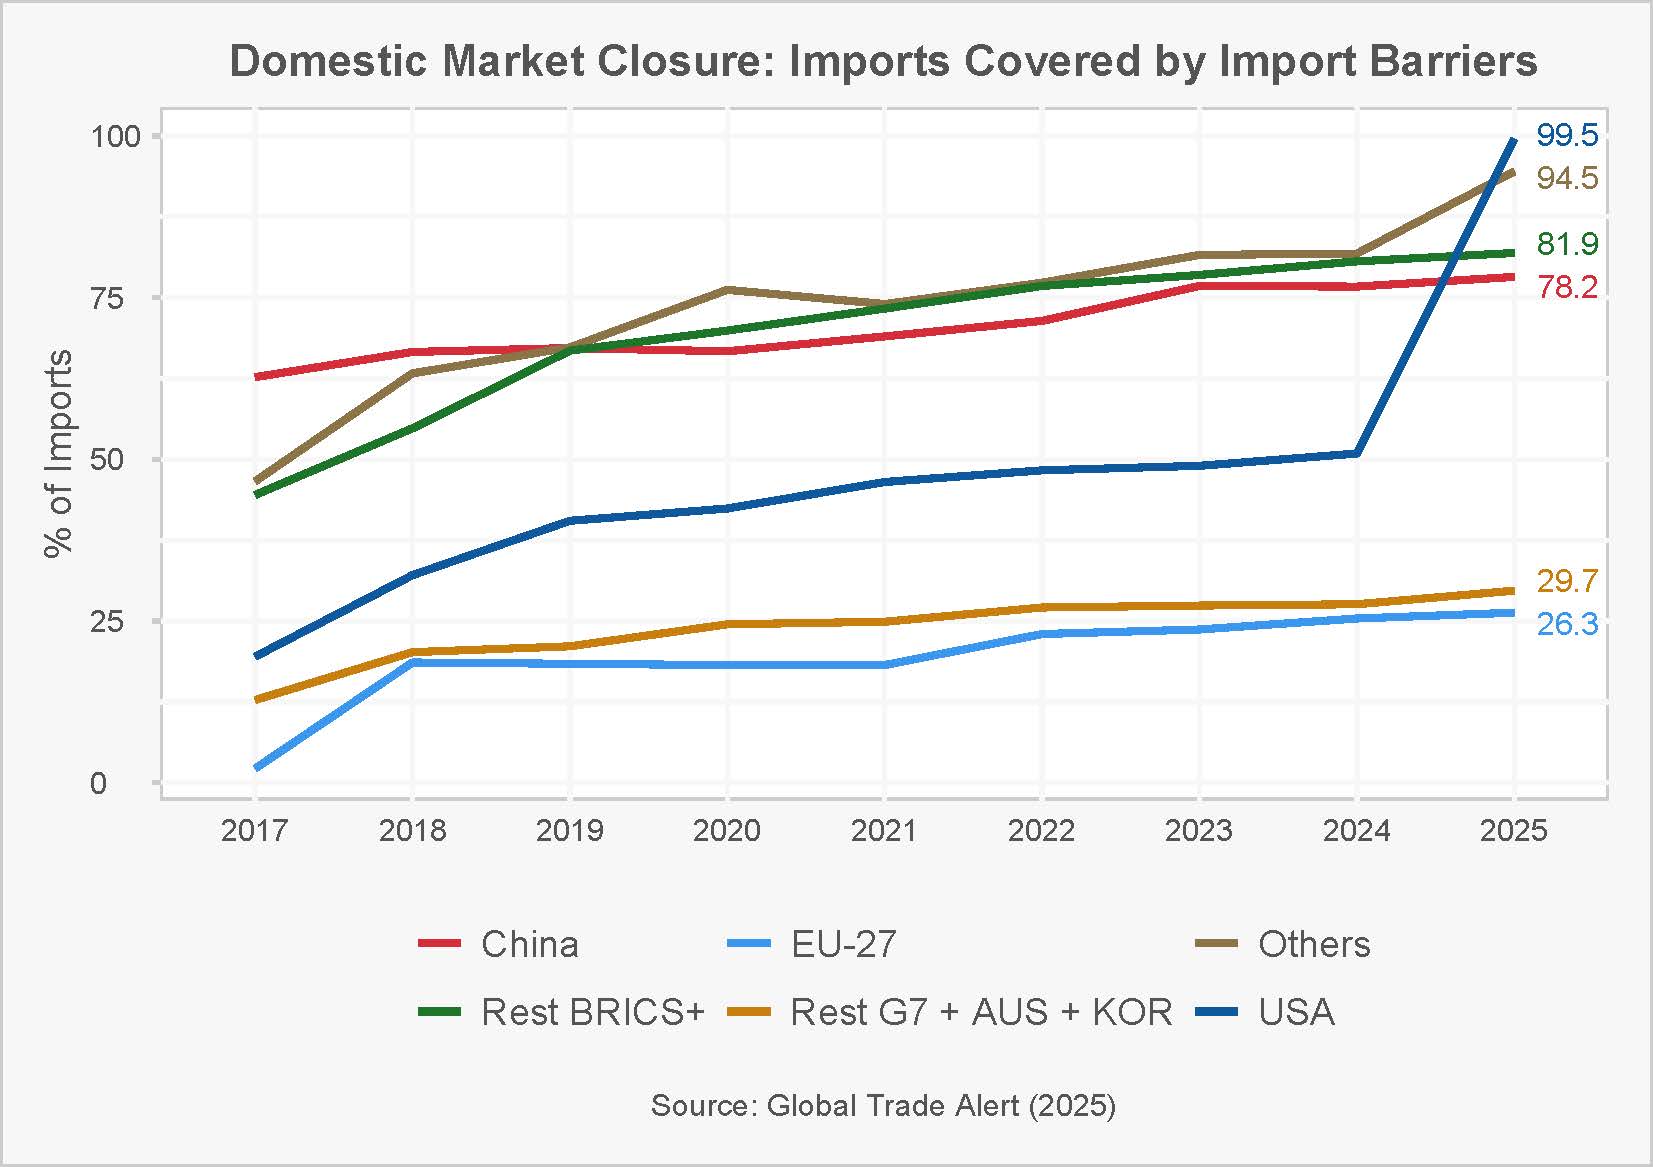
How was Figure 8 prepared?
We start from the Global Trade Alert (GTA) database and select all the import barriers implemented from 2017 to 2025. We then map these measures to BACI/CEPII 2017 trade data to estimate the percentage of each country’s domestic market covered in a given year.
Construction (conservative, year-end stock):
- A measure counts for year t only if it is in force on 31 December of year t (measures lifted before year-end are not counted; measures introduced late in the year are counted if active at year-end).
- Measures are mapped to HS product lines and any country targeting indicated in GTA, then matched to same-year BACI values.
- For each reporter and year, coverage is the trade-weighted union of affected product–partner cells (a cell hit by multiple measures counts once; coverage is capped at 100%).
Results are shown for imports (percentage of a country’s inbound goods affected). EU-27 is treated as a single reporter.
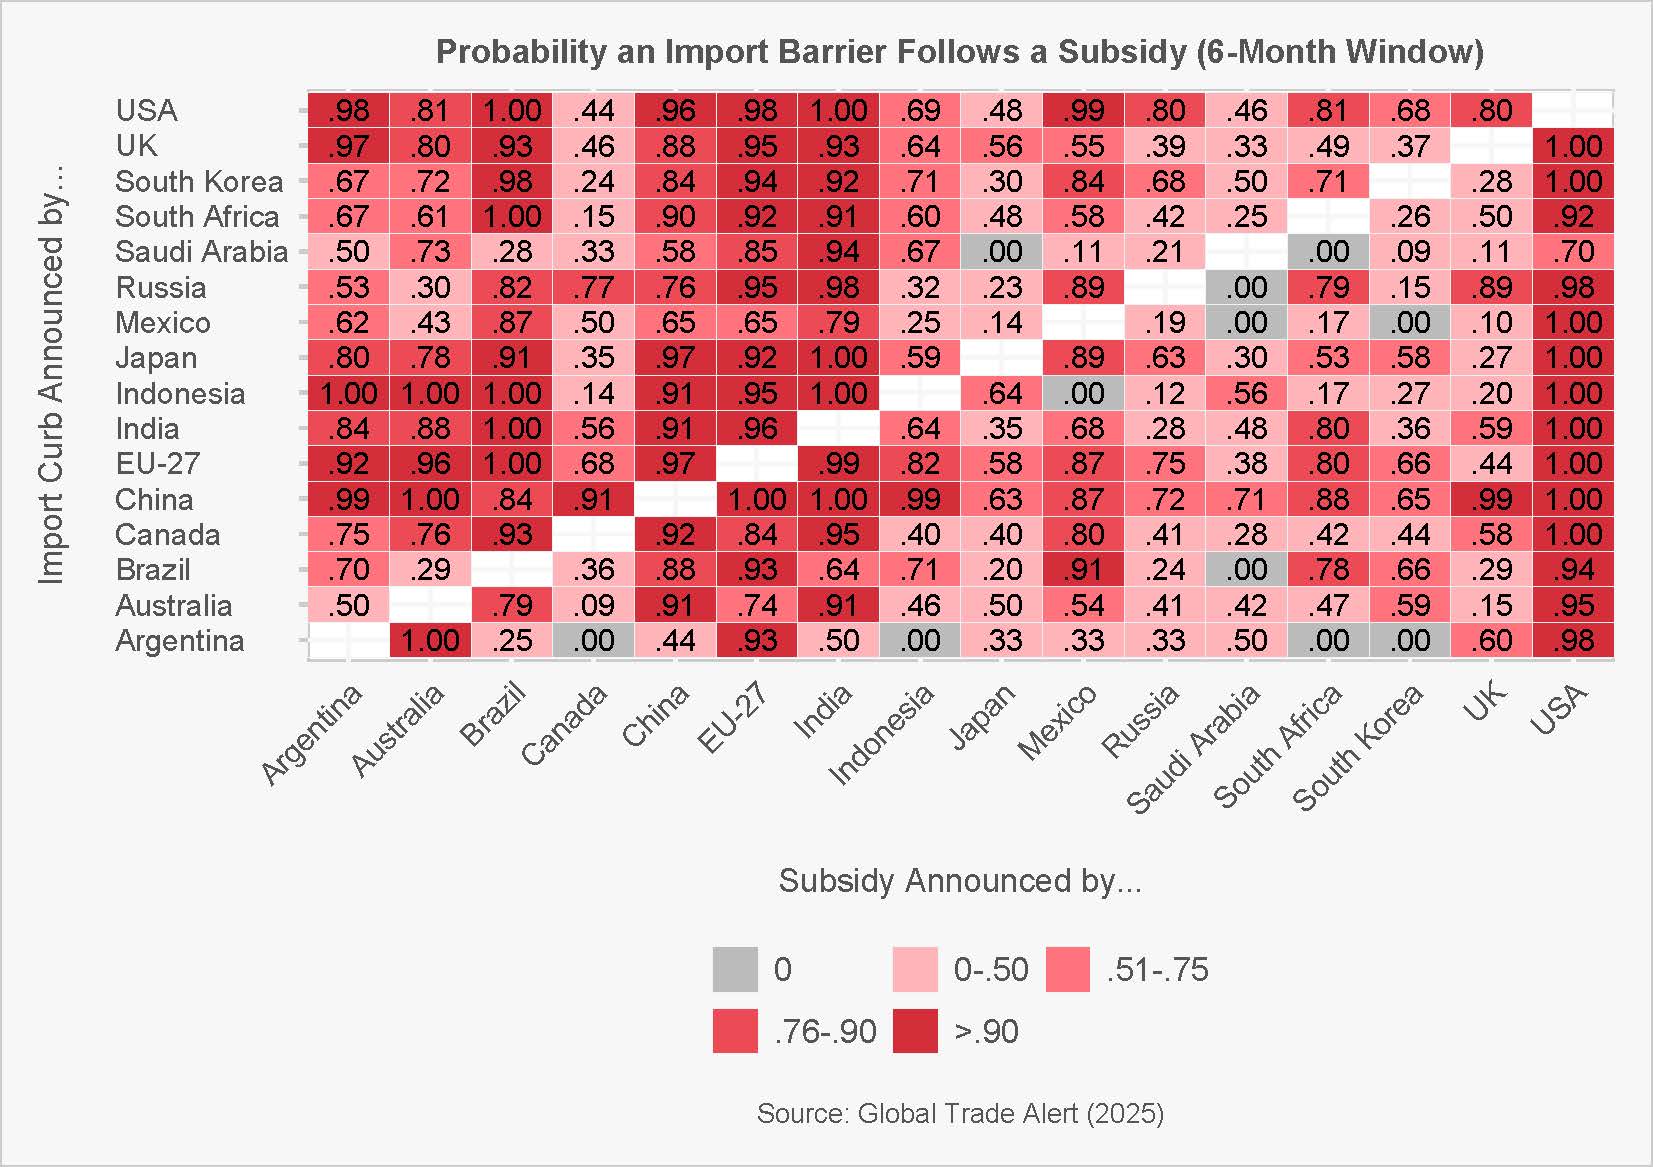
Figure 9. From Subsidy to Shield: G20 Probabilities of Import Barriers Within Six Months
How was Figure 9 prepared?
Figure 9 measures how often a G20 member announces an import barrier within six months after another G20 member announces a subsidy. We start from Global Trade Alert (GTA), taking all merchandise subsidies (by announcement date) and all import barriers—tariffs/bans and trade-defence actions such as AD/CVD/SG. Services are excluded and the EU-27 is treated as a single member. Each subsidy is mapped at the HS-6 product level and paired with any import barrier that targets the same product line and the subsidy’s origin country within a 180-day window. If multiple barriers occur within that window, the event is counted once.
For every ordered country pair, we compute the probability that an import barrier follows a partner’s subsidy: the number of that partner’s subsidy events that trigger at least one barrier within six months divided by the total number of eligible subsidy events. This yields a value between 0 and 1 for each country pairs.
The heatmap is read by rows and columns. Rows indicate the country announcing the import curb; columns indicate the country announcing the subsidy. Darker red cells represent higher probabilities that a given country responds to a specific partner’s subsidy with an import barrier inside six months.
Two broad patterns are observed. First, large traders and systemically important partners—such as the EU-27, China, India, and the United States—tend to elicit higher response probabilities across counterparts, consistent with their greater exposure and salience in global value chains. Second, China shows a notably high propensity to respond across many partners, while the United States and India appear among the most active implementers of import barriers overall. These patterns suggest an increasingly reciprocal, security-framed use of trade instruments within the G20.
This is an incidence metric rather than a causal estimate. It does not weight events by trade value or measure the restrictiveness of individual actions, and it cannot rule out third-country or common-shock effects. Nonetheless, it provides a compact view of who tends to retaliate against whom—and how quickly—when subsidies are deployed.
Industrial Policy & Subsidies
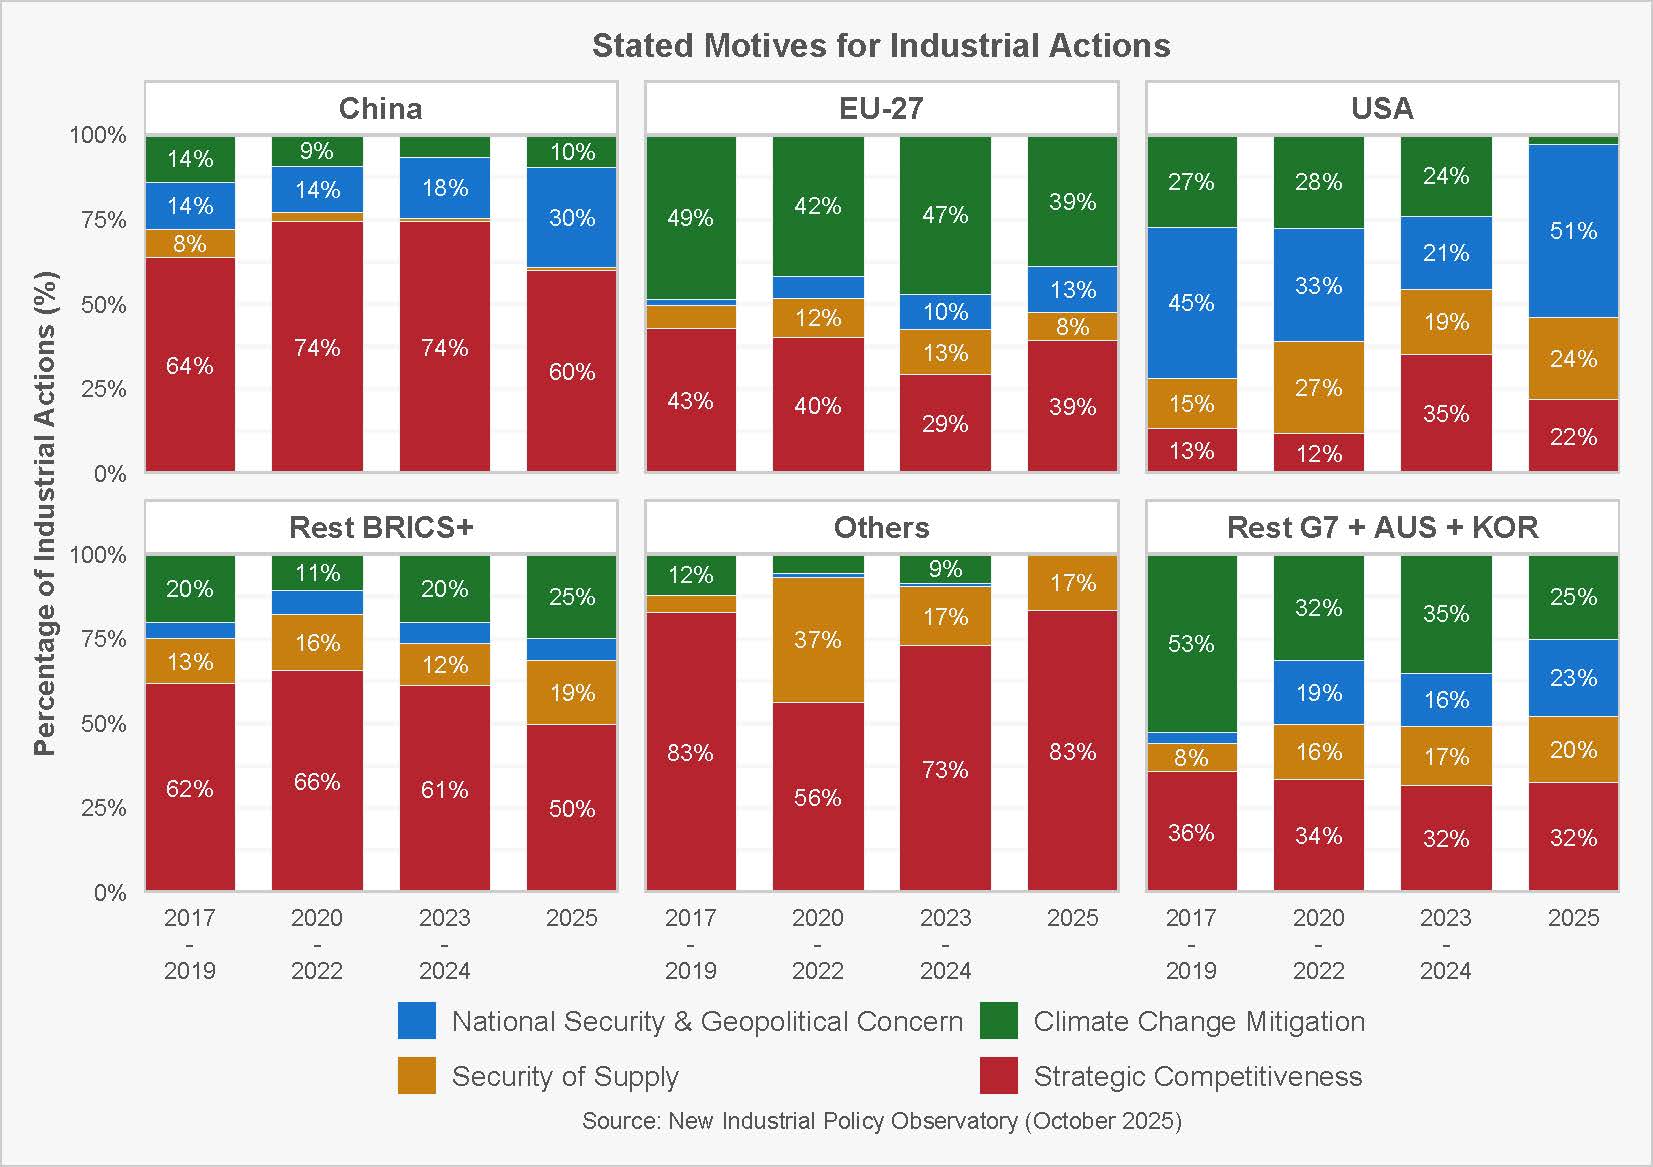
Figure 10. Security Trumps Climate: Diverging Motives for Industrial Actions Across Blocs
How was Figure 10 prepared?
The chart shows, for each bloc, the percentage of industrial policies implemented every year attributed to each stated motive. Colours correspond to “National security or geopolitical concern,” “Resilience/Security of supply,” “Strategic competitiveness,” and “Climate change mitigation”. Within any bloc–period, the percentages add up to roughly 100%, so you can compare how the composition of motives evolves over time as well as how it differs across blocs.
Starting from intervention-level records, each measure can carry multiple motives. Rather than double-count such cases, we use proportional apportionment: if an intervention cites k motives, it contributes 1/k to each of those motives. We then aggregate these weighted contributions by bloc and period (e.g., 2017–2019, 2020–2022, 2023–2024, 2025) and divide by the total number of distinct interventions in that bloc–period to obtain percentage shares.
Read across periods within a bloc to see whether policy justifications are becoming more explicit and strategic. Comparing blocs side-by-side highlights different policy styles: some lean heavily into strategic or climate frames, while others place more emphasis on resilience/security of supply.
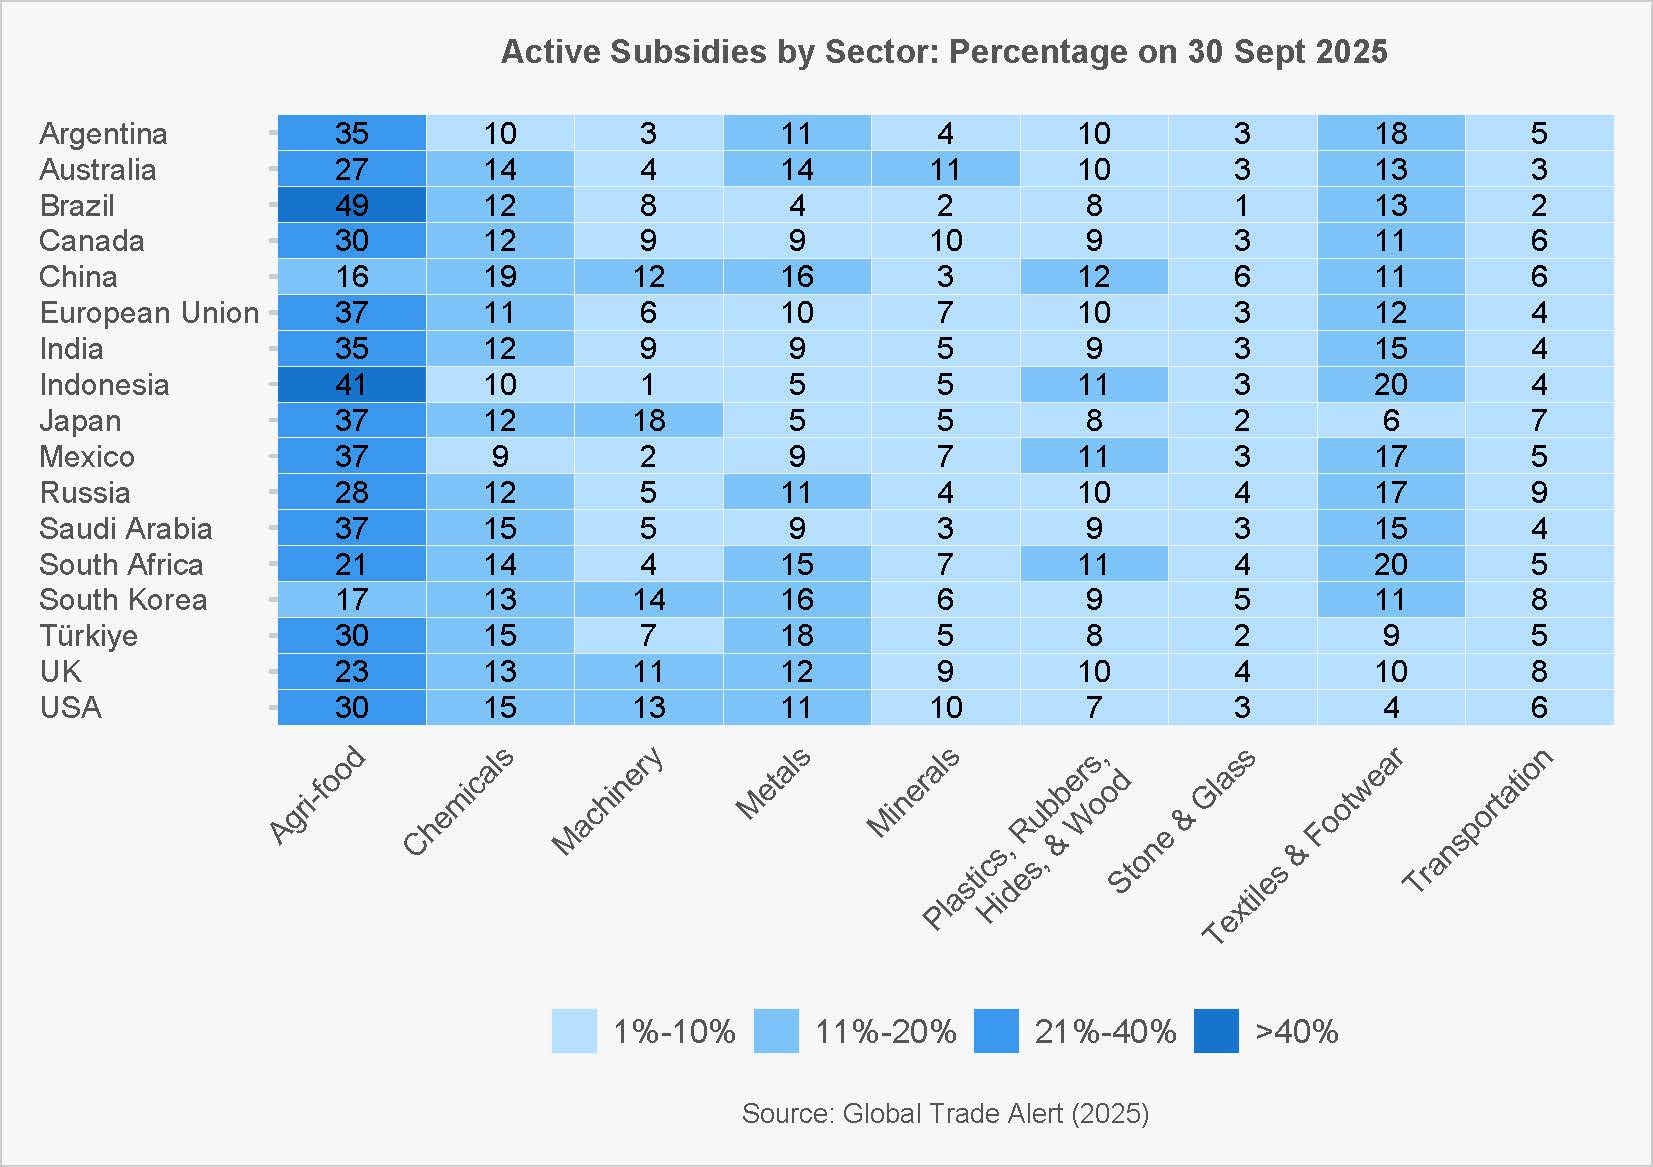
Figure 11. The Subsidy Footprint Across Sectors: Agrifood Dominates
How was Figure 11 prepared?
For each G20 economy (EU-27 measures are aggregated under “EU-27” and intra-EU effects are excluded), the heatmap displays the percentage distribution of active domestic subsidy measures by broad goods sector as of 30 Sept 2025. The ten columns are sector groupings derived from HS chapters (e.g., Agrifood, Chemicals, Metals, Machinery). Percentages within a country sum to ~100% (minor differences come from rounding), letting you compare sector mix within a country and profiles across countries.
HS codes are mapped to 10 broad sectors using HS chapter ranges:
- 01–24 Agrifood
- 25–27 Minerals
- 28–38 Chemicals
- 39–49 Plastics, Rubbers, Hides & Wood
- 50–67 Textiles & Footwear
- 68–71 Stone & Glass
- 72–83 Metals
- 84–85 Machinery
- 86–89 Transportation
To avoid inflating counts within a sector, we deduplicate to one record per intervention–country–sector (multiple HS codes inside the same sector still count once). For each country, we count intervention–sector pairs by sector and divide by the country’s total across all sectors, yielding percentage shares (rounded to whole numbers).
Scan across a row to see a country’s subsidy footprint; darker cells indicate concentration in that sector. Comparing rows reveals differing policy profiles—for example, the Agrifood column often carries notably high percentages, signalling how frequently food and agriculture are the focus of active subsidy measures in many economies.
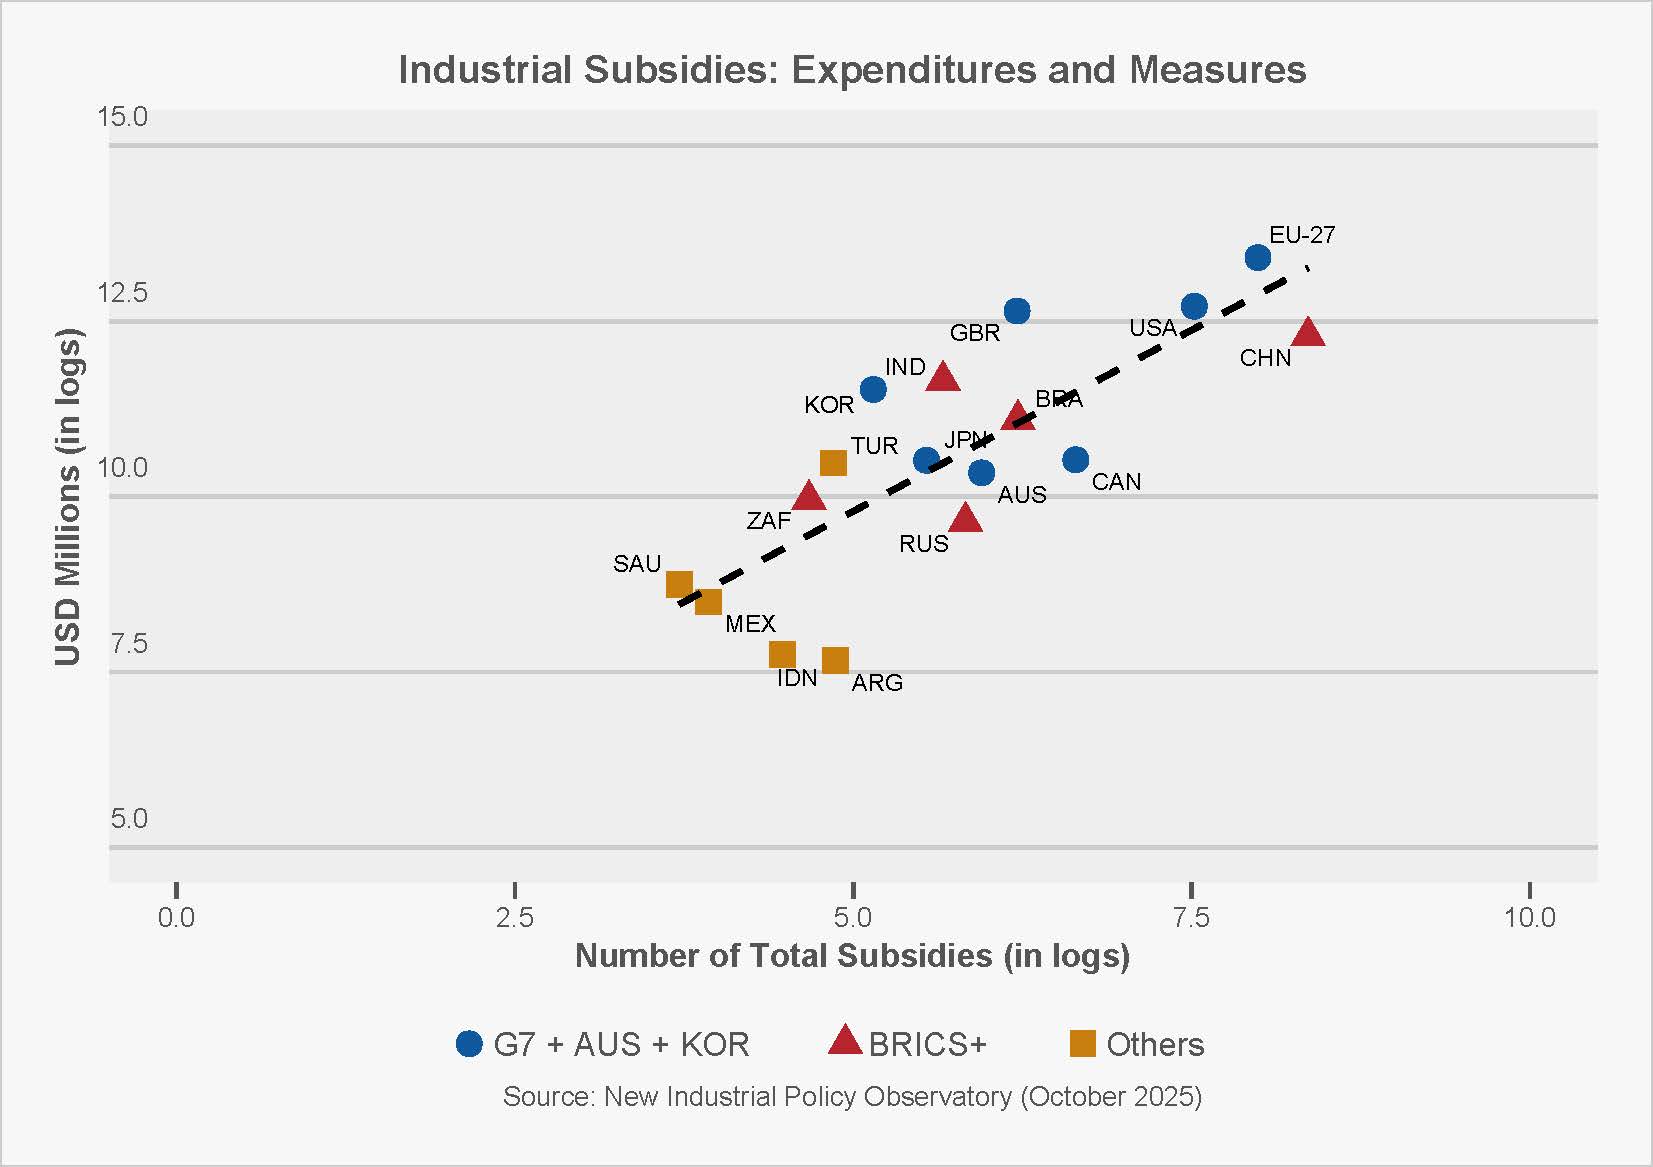
Figure 12. How Many vs How Much: Industrial Subsidies with a Three-Regime Split
How was Figure 12 prepared?
Using data from the latest New Industrial Policy Observatory (October 2025), we calculated the domestic subsidy allocations announced and number of subsidies by each G20 member from 2020. The NIPO database tracks 12,821 domestic subsidies across the G20 implemented since January 2020.
A country-by-country scatter of industrial subsidy activity vs. spend (G20 + EU-27). X-axis (ln count): natural log of the number of distinct distortive subsidy measures. Y-axis (ln USD mn): natural log of the sum of reported subsidy amounts (USD millions). Markers: colour/shape denote groups — G7 + AUS + KOR (blue ●), BRICS+ (red ▲), Others (amber ■). Dashed line: one overall OLS fit across all economies.
Moving right ⇒ more measures; moving up ⇒ larger total spend. The trend line is the expected spend given the number of measures. Above the line: countries spending more per measure on average (larger budgets/measure or a few very large schemes). Below the line: countries with leaner budgets per measure. Group colours/shapes let you compare regimes at a glance (e.g., several advanced economies cluster toward the upper-right, while some “Others” sit below the line at lower spend for a given count).
Amounts reflect recorded budget figures; reporting practices differ across countries, so levels are indicative rather than strictly comparable. Logs compress skew and make the slope interpretable as an elasticity (percent change in spend vs. percent change in measure count).
G20 Services Trade
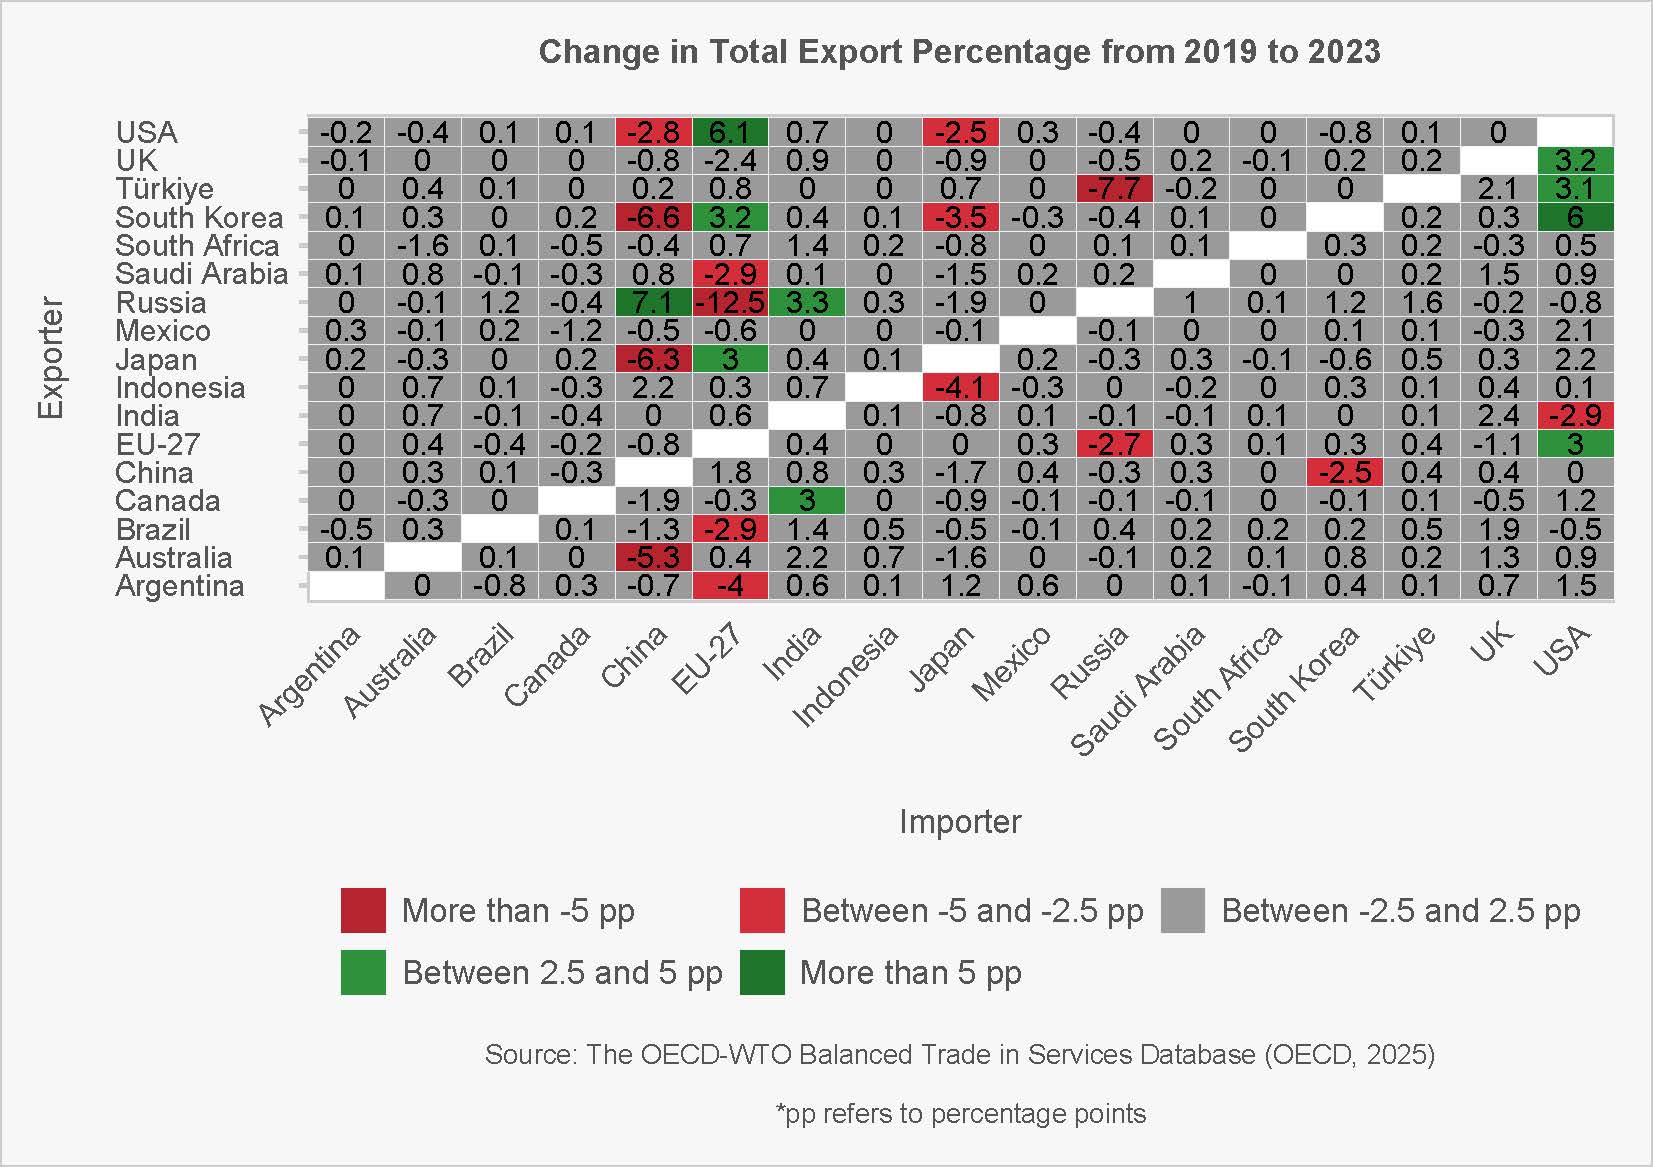
Figure 13. Services Export Destinations Rebalance: U.S. Up, Russia Down, China Mixed
How was Figure 13 prepared?
A heatmap of percentage-point (pp) changes in the destination mix of total services exports between 2019 and 2023 for each exporter (rows).
- A green cell means that partner’s share of the exporter’s total services exports increased; red means it fell; grey ≈ little change.
- Values are shares within each exporter, so gains for some partners are offset by losses for others (and by “rest of world,” which is not shown).
How to read a cell
- Australia → China: −5.3 means the share of Australia’s services exports going to China fell by 5.3 pp from 2019 to 2023 (e.g., from 16% to 10.7%).
- • South Korea → USA: +6.0 means the US share of Korea’s services exports rose by about six pp over the period.
- EU-27 → Russia: −2.7 signals a lower Russian share in the EU-27’s services export mix.
- Patterns at a glance
- Bigger US destination shares for several exporters (e.g., South Korea, the UK, Türkiye and the EU-27), indicating a tilt toward the US market in services.
- For most pairs the changes are modest (±2.5 pp), underscoring that overall destination mixes changed, but not wholesale.
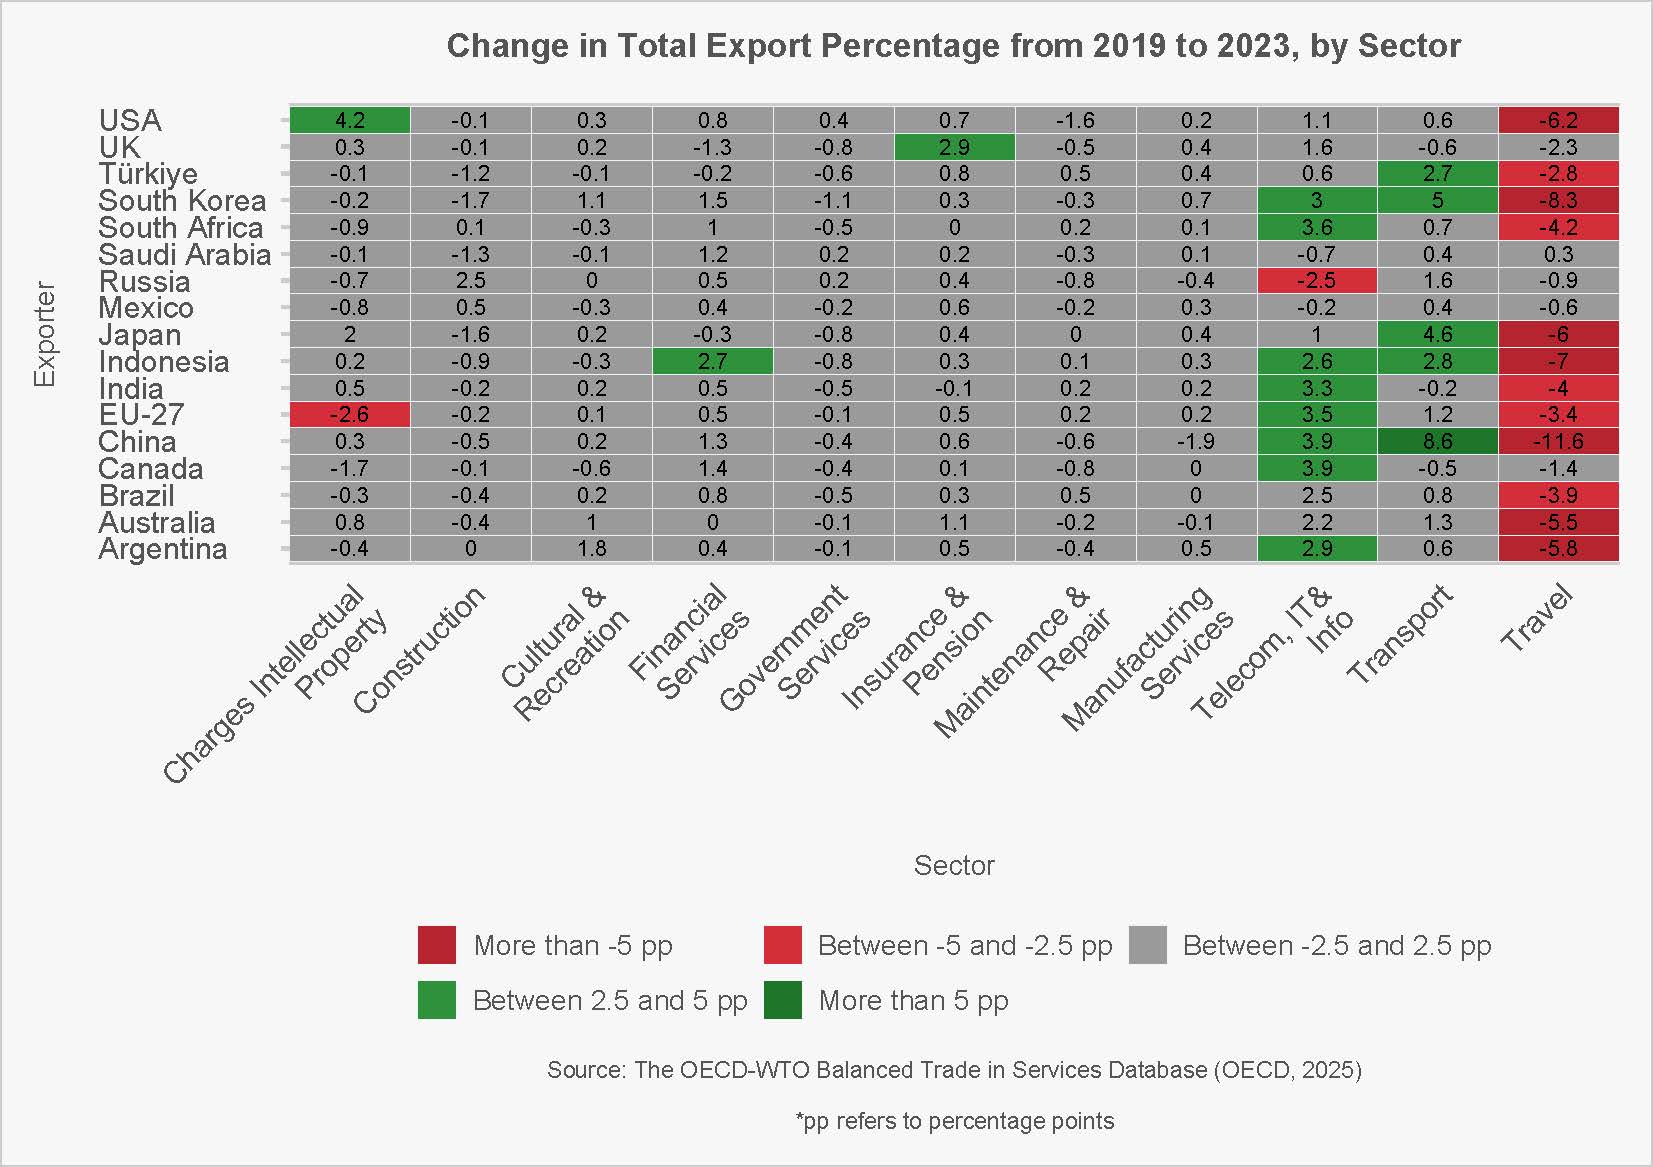
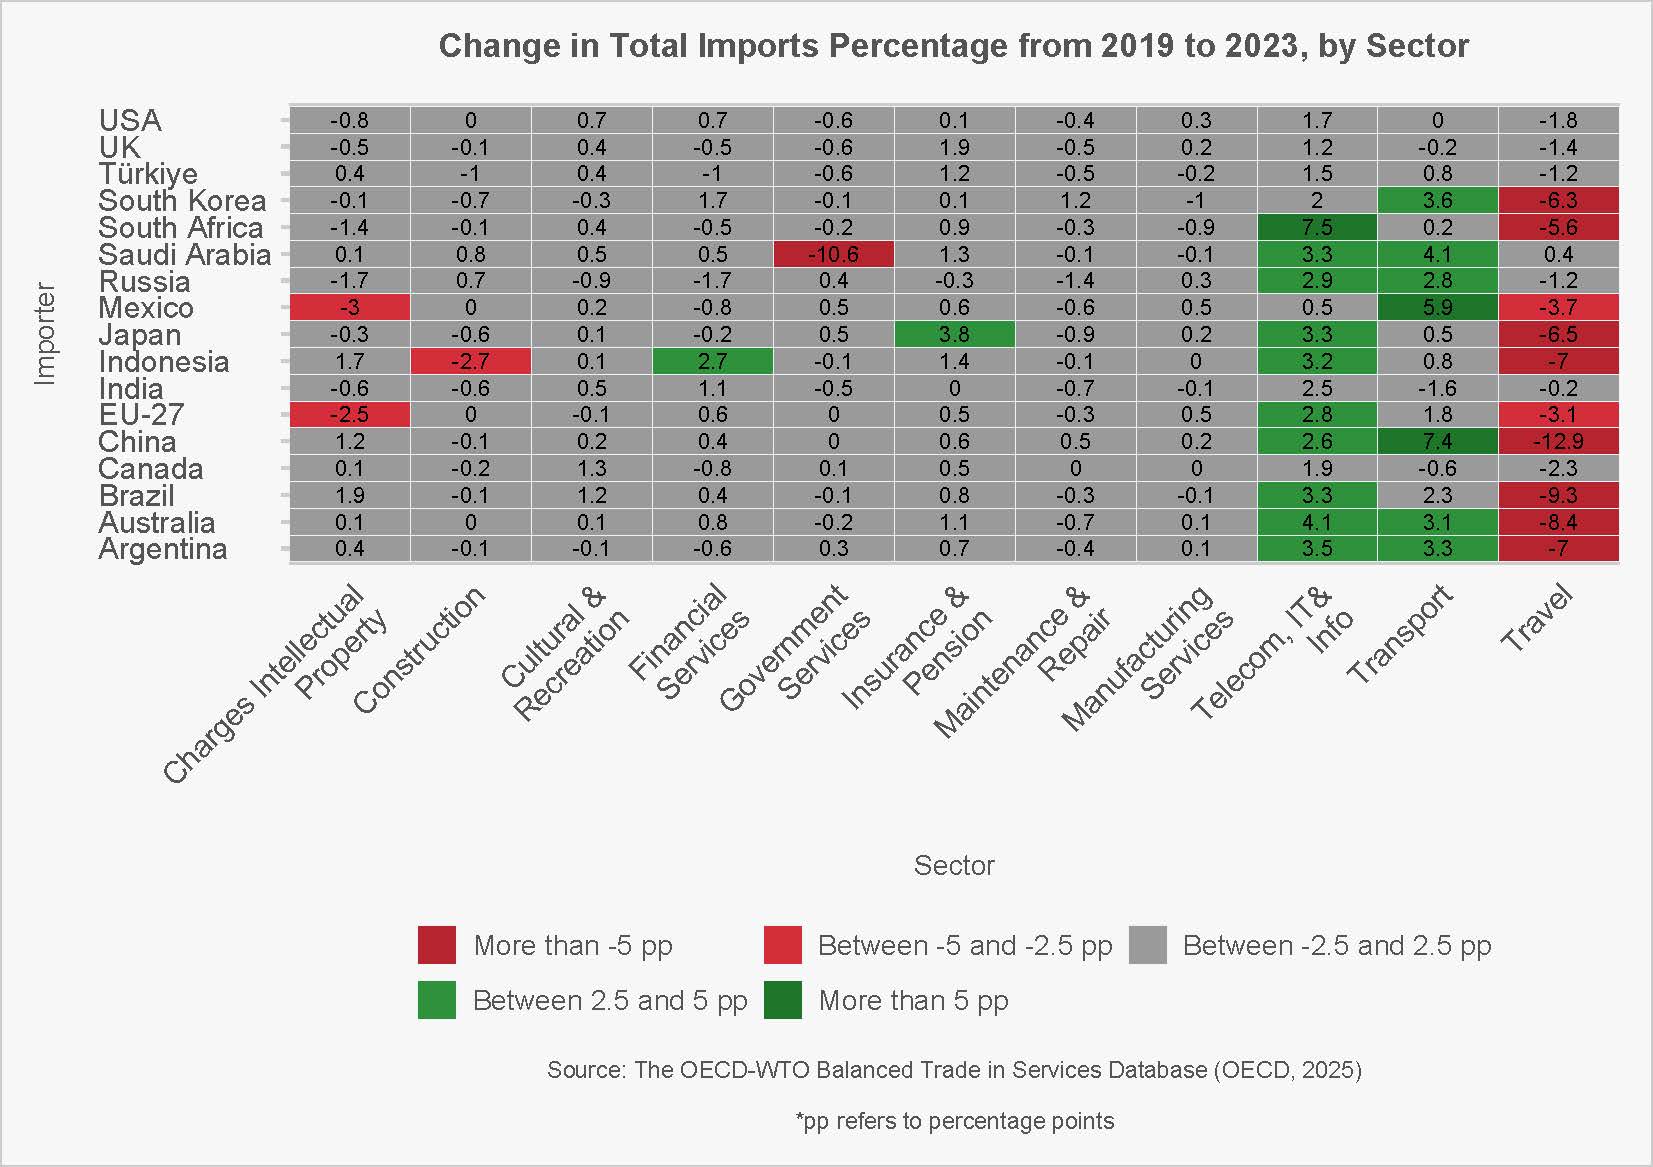
Figure 14. Post-Pandemic Services Mix: Telecom/IT Up, Travel Down
How was Figure 14 prepared?
How was Figure 14 prepared?
Each heatmap tracks percentage-point (pp) changes in sector shares of total services between 2019 and 2023 for the G20 and the EU-27.
-
Cell values = how many pp that sector’s share of total services exports (top) or imports (bottom) changed since 2019 (greens ↑, reds ↓, greys ≈ little change).
Broad rise in “Telecom, IT & Information” on both the export and import sides, consistent with continued digitalisation of cross-border services. Large, widespread declines in “Travel” shares in both exports and imports—pandemic shock effects outweighing the subsequent rebound in many economies by 2023. Transport often nudged up on imports (logistics normalisation), with smaller, mixed moves on exports. IP charges, finance, insurance show country-specific shifts (e.g., some advanced economies’ export mix tilted a bit more to IP/finance, while others moved toward professional/technical services captured within “Telecom, IT & Info” or “Other business” buckets in related figures). Government services, maintenance & repair, construction generally saw modest share changes relative to the big movers above.
Sectors
-
Charges Intellectual Property — royalties/licence fees for the use of IP (patents, trademarks, franchises, copyrights).
-
Construction — on-site and remotely managed construction services.
-
Cultural & Recreation — personal, cultural & recreational services supplied cross-border (incl. audiovisual).
-
Financial Services — intermediation, brokerage, asset management, payments provided remotely.
-
Government Services — memo item “government goods & services n.i.e.” (non-commercial government transactions).
-
Insurance & Pension — non-life/life insurance services, reinsurance, pension administration.
-
Maintenance & Repair — maintenance/repair services n.i.e. of goods not included elsewhere.
-
Manufacturing Services — processing on physical inputs owned by others.
-
Telecom, IT & Info — telecommunications + computer services + information services.
-
Transport — sea, air, other modes, postal & courier.
-
Travel — expenditure on goods/services for personal or business travel (excl. international transport).
How to read a cell
-
If a cell shows +3.0 under Telecom, IT & Info for a country’s exports, that sector’s share of that country’s total services exports rose by 3.0 pp between 2019 and 2023 (e.g., from 10% to 13%).
-
If a cell shows −8.0 under Travel on imports, the import share of travel fell by 8 pp over the period.
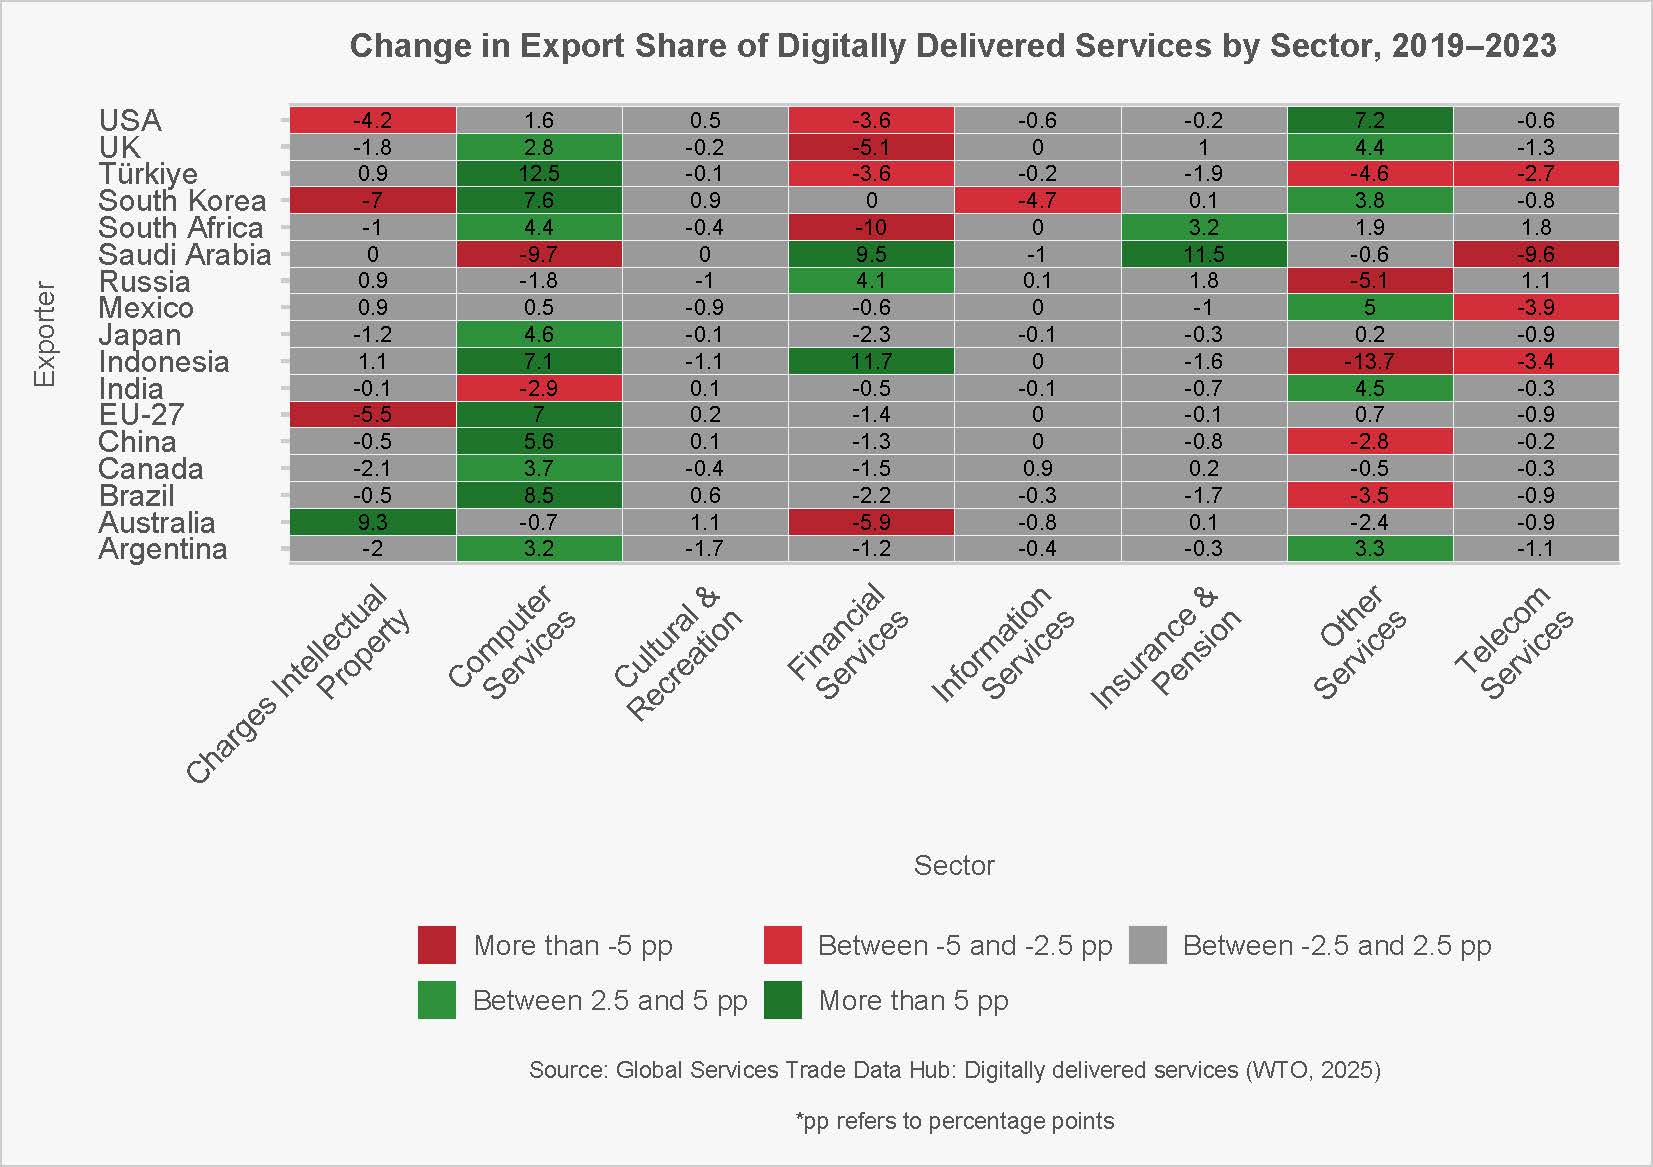
Figure 15. Digitally Delivered Services Shift Toward Computer Services Across Trade
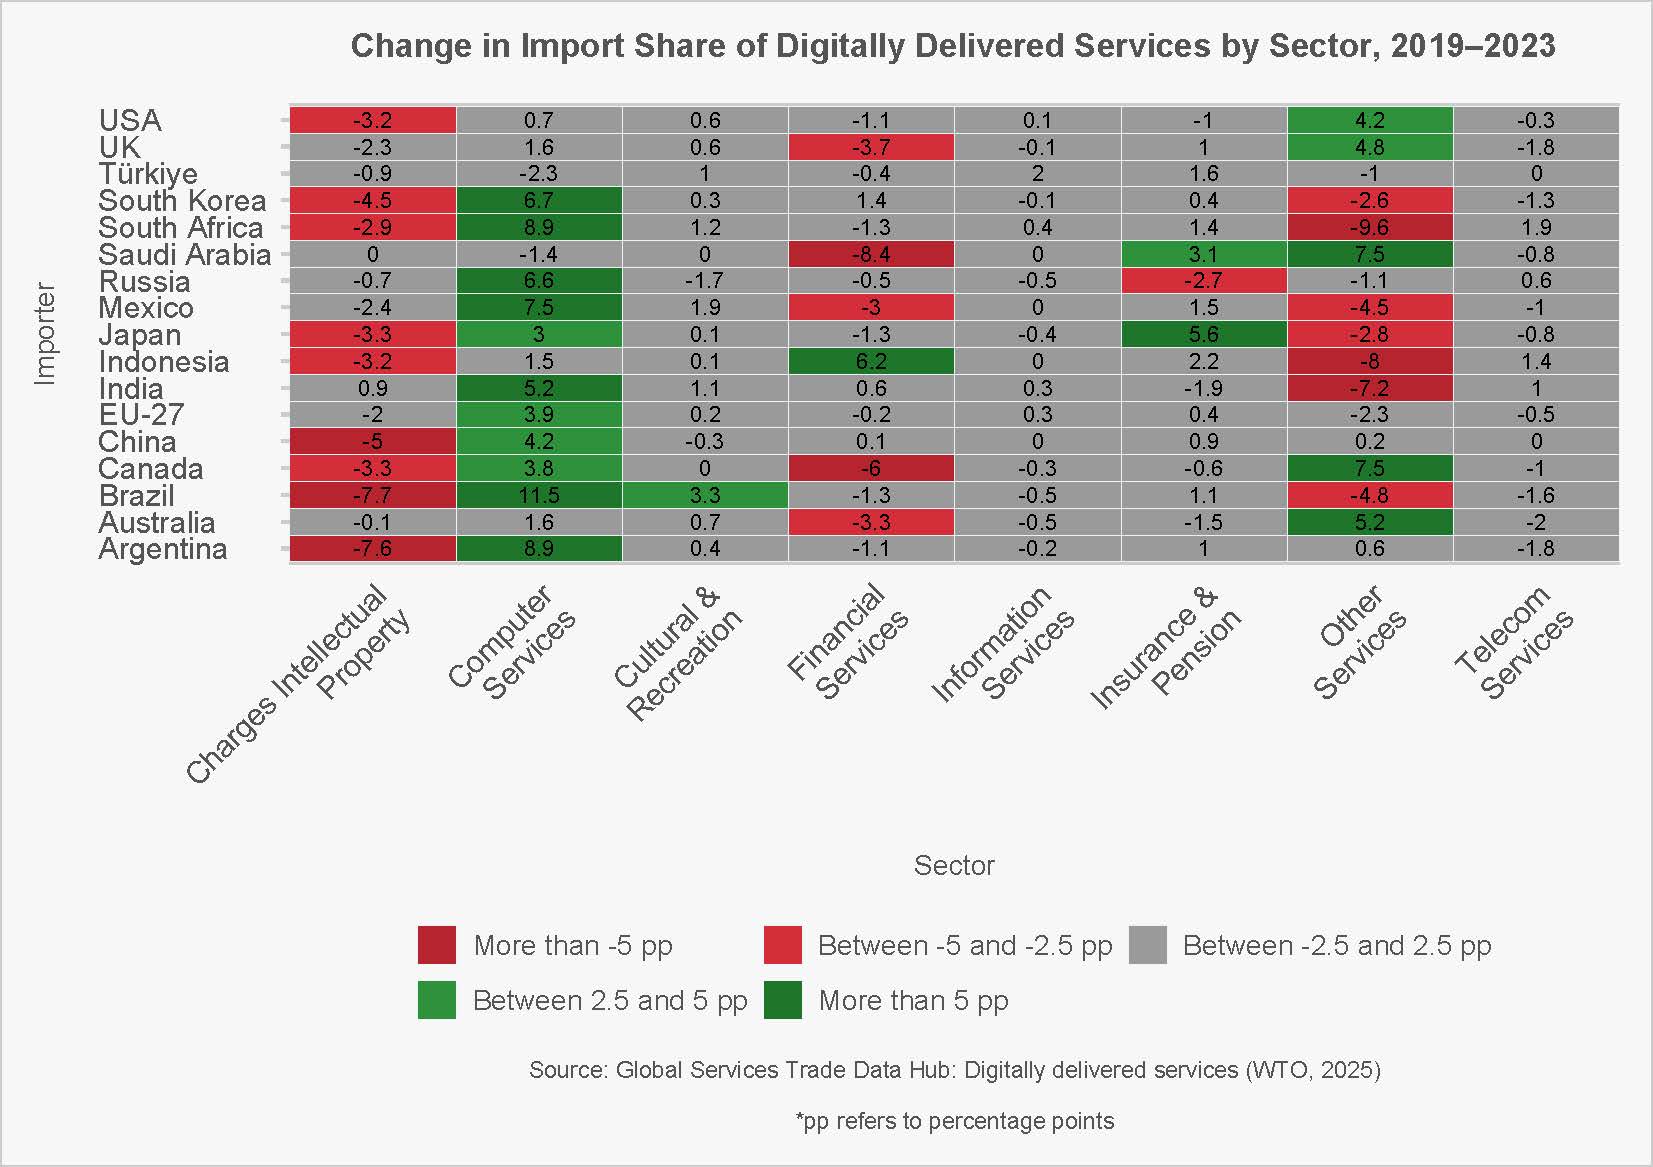
How was Figure 15 prepared?
Each heatmap tracks how the composition of digitally delivered services (DDS) changed between 2019 and 2023 for the G20 economies (plus the EU-27).
- Rows = countries. Columns = DDS sectors.
- Numbers = percentage-point (pp) changes in the sector’s share of that country’s DDS exports (top chart) or DDS imports (bottom chart).
Computer services gained share for many economies on both export and import sides (e.g., Türkiye +12.5 pp in exports; Brazil +11.5 pp in imports). Charges for intellectual property (IP) often lost share (e.g., EU-27 −5.5 pp in exports; Argentina −7.6 pp in imports). Financial and insurance services are mixed: some large increases (e.g., Saudi Arabia’s export shares), but notable declines in traditional financial hubs (e.g., UK finance exports −5.1 pp). “Other services” (largely other business services) frequently picked up share for advanced economies’ exports (e.g., United States +7.2 pp) but not universally on imports. Telecom and information services generally show smaller, incremental changes.
Sector descriptions
- Charges Intellectual Property — royalties/licence fees for the use of IP (trademarks, franchises, copyrights, patents) delivered remotely.
- Computer Services — software development, cloud & hosting, IT support, systems integration, data processing/AI services.
- Cultural & Recreation — the digitally delivered part of personal, cultural & recreational services (e.g., audiovisual, streaming, games, creative services).
- Financial Services — intermediation, brokerage, asset management, payment services provided cross-border without the provider or consumer travelling.
- Information Services — news agency services, web portals, data & database services, web search, market-intelligence feeds.
- Insurance & Pension — non-life and life insurance services, reinsurance, pension administration delivered remotely. Other Services — mostly other business services: R&D, professional & management consulting, and technical/trade-related services (often delivered digitally).
- Telecom Services — voice, messaging, and data transmission over fixed/mobile networks.
How to read a cell
- Exports example — Australia, “Charges IP”: +9.3. Australia’s DDS export mix shifted toward IP-related receipts: the IP share of its DDS exports in 2023 was 9.3 pp higher than in 2019. If IP was 4% of DDS exports in 2019, it would be ~13.3% in 2023.
- Imports example — Brazil, “Computer services”: +11.5. Computer services made up a much larger share of Brazil’s DDS imports in 2023 than in 2019. If the share was 12% in 2019, an +11.5 pp change implies ~23.5% in 2023.