Our goal here is to demonstrate how readily available trade statistics can inform debates about the growing threat posed by China’s most successful goods exports to the vanguard firms in her trading partners. We analyse the overlap between China’s top export products and the export portfolios of major trading partners. We calculate the shares of a trading partner’s exports that fall within the largest 25 or 100 product lines that China exported in 2023, the latest year a complete set of global trade data is available. These shares can be easily interpreted, unlike indices deployed by others and they are less volatile than the monthly official trade data releases that have driven so much media reporting during 2025. We benchmark the 2023 results against those in 2015, the year when the Made in China 2025 industrial policy began to be implemented. Our choice of trading partners allows for benchmarking across regions, levels of development, and geopolitical distance from Beijing. To fix ideas, we set out seven hypotheses of relevance to business and policymakers. We evaluate each hypothesis using the export overlap statistics and highlight which aspects of the current narrative concerning the Chinese export surge diverge from underlying evidence—a narrative we also put in its appropriate context using 2025 data.
Authors
Simon Evenett, Stefan Legge
Date Published
17 Dec 2025
Related Topics:

1
Simon J. Evenett is a Professor of Geopolitics & Strategy, IMD Business School; Founder, St. Gallen Endowment for Prosperity Through Trade; and Co-Chair, Trade & Investment Global Future Council, World Economic Forum. Contact email address: simon.evenett@imd.org
2
Stefan Legge is the Vice Director and Head of Tax & Trade Policy, Institute for Law and Economics, University of St.Gallen; Contact email address: stefan.legge@unisg.ch
Keywords: China, exports, competitiveness, industrial policy, Five Year Plan
Executive Summary
Some contend that trade relations with China are currently at an inflection point, painting a picture of an export surge from China that poses an across-the-board threat to vanguard firms in her trading partners. This paper examines the export overlap between China and major trading partners in the years since the Made in China 2025 industrial policy came into force. We provide an easy-to-interpret measure of foreign competitive exposure to China’s top export lines which allow for comparisons across countries and time.
We calculate the shares of partner-country exports that fall within China’s top 25 and top 100 export lines. As exporting tends to be done by higher productivity firms (Melitz, 2003), our overlap statistics reveal the degree to which vanguard firms in China and elsewhere are going head-to-head in world markets. Rising shares indicate greater exposure; falling shares indicate greater international specialisation, possibly due to exit by foreign firms in response to intensifying Chinese export competition.
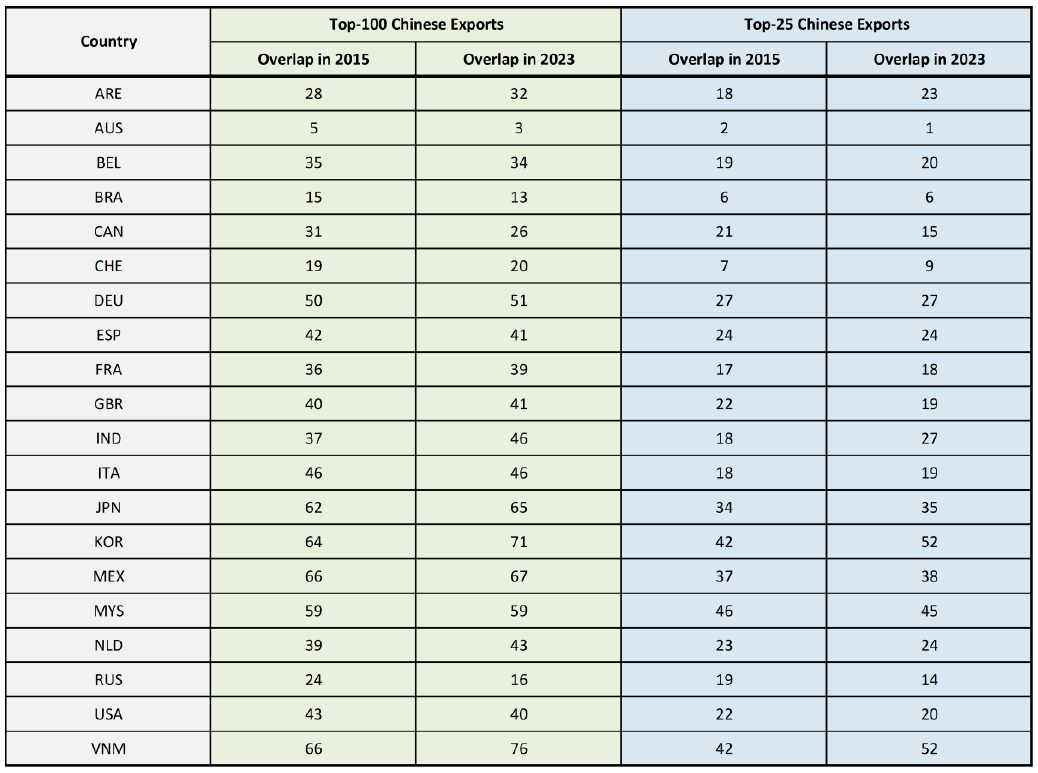
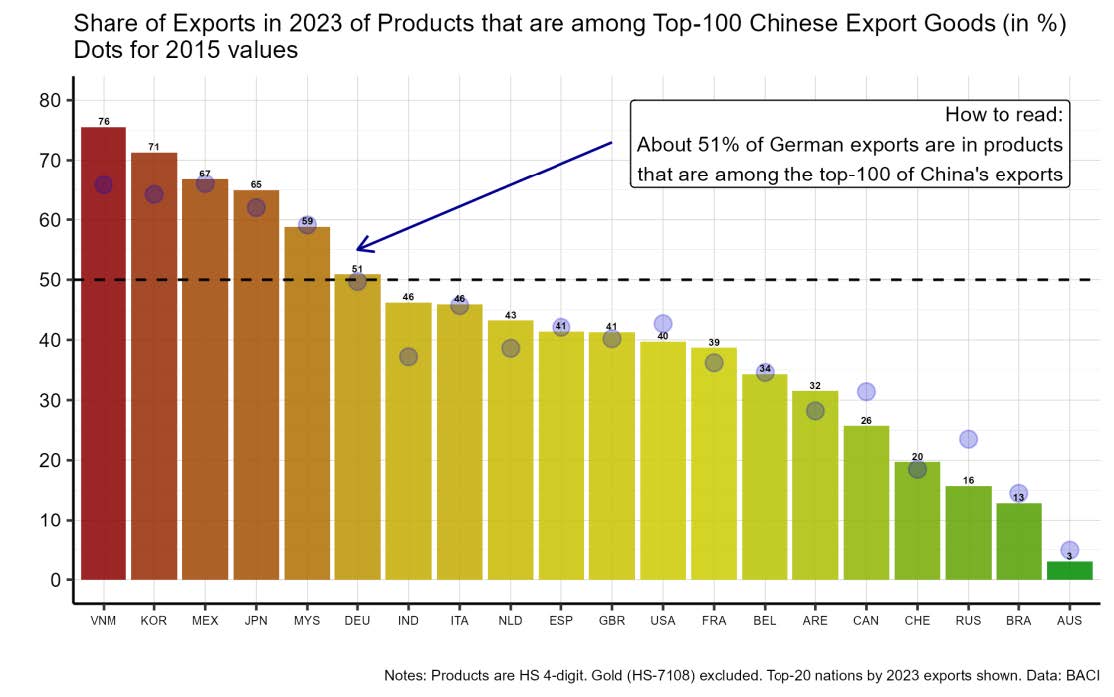
The results for the top 100 Chinese export products show that overlap levels are highest in East & Southeast Asia and in Mexico. Vietnam records an export overlap of 76 per cent, South Korea 71 per cent, Japan 65 per cent, and Mexico 67 per cent. These levels far exceed those in Europe and elsewhere in the Western Hemisphere—where most nations still see much less than half their exports compete against Chinese rivals in world markets. Claims that Chinese exports threaten foreign vanguard firms across-the-board are wrong.
North American export overlap is moderate. The United States records 40 per cent overlap in 2023, down from 43 per cent in 2015. This means that three-fifths of American exports by value are currently in product lines where Chinese exporters do not excel at scale. Canada records an overlap of just 26 per cent, which bounds the size of the Chinese competitive threat. Around 13% of Brazil’s exports compete head-to-head with top Chinese exporters. With stagnant shares in Mexico, export data does not support a narrative of growing threats to vanguard firms and of deindustrialisation to economies in the Western Hemisphere.
European exposure is lower than that found in East Asia and, critically, has changed little since 2015. When China’s top 25 export categories are considered, less than 30 per cent of the total exports of each European nation considered here are in the same lines of business. When the perspective widens to the top 100 Chinese export categories, Germany records 51 per cent export exposure—meaning that nearly half of its exports are not in products where Chinese firms excel on world markets. Every other European nation considered here has a lower export overlap than Germany, Belgium and France in particular.
Overall, our evidence does not support policymaker narratives about "inflection points" in competitive pressure from Chinese exports. Our data offers stronger support for claims about East Asian vulnerability. Narratives of an ever-more menacing Chinese export juggernaut simultaneously threatening vanguard firms around the globe are not supported. That is not to deny that certain lines of business are currently subject to competitive threats from innovative and lower cost Chinese counterparts. European firms worried about rising Chinese competitive pressures should examine how their Japanese and Korean rivals responded to an even greater exposure to successful Chinese exports.
1. Context: The 2025 Narrative Relating to Chinese Export Growth
Throughout 2025, articles in leading international business newspapers have contended that an export surge from China poses a competitive threat to producers around the world. News that China’s good trade surplus had topped $1 trillion during the first 11 months of 2025 triggered foreboding about the prospects for protectionism and about the impact of China’s industrial policy (The FT View, 2025; Ip, 2025).
These concerns have been particularly prominent in Europe, where firms and politicians are contemplating raising trade barriers against imported Chinese goods. Tariffs of up to 45 per cent on electric vehicles imposed by the European Union in 2024 could serve as a precursor. Some have even proposed changing the terms upon which China supply European customers—for example, by requiring Chinese firms to establish production facilities in Europe and transfer technology (Hancock, Bounds and Russell 2024)
In July 2025, European Commission President Ursula von der Leyen warned Chinese leader Xi Jinping that EU–China relations had reached “an inflection point”, emphasising that “to be sustainable, relations need to be mutually beneficial” (McMorrow, Leahy and Foy (2025)). Von der Leyen called for “rebalancing our bilateral relations”, noting that “as our cooperation has deepened, so have imbalances.” Xi Jinping responded that relations were at a “critical juncture”, calling on Brussels to “exercise restraint” in using trade defence tools, whilst warning that decoupling supply chains would “only lead to self-isolation.”
Four factors have been linked to heightened tensions. First, the administration of US President Donald Trump has imposed very high tariffs on Chinese imports, prompting concerns about trade redirection. Von der Leyen warned about “Chinese exports diverted from the US by Trump’s measures” flooding European markets and called for “a mechanism for tracking possible trade diversion.” Second, continued falling producer prices in China—reflecting, some contend, deficient levels of aggregate demand in China—are said to have increased the incentive of Chinese firms to find customers abroad.
Third, reports on China’s formulation of its 15th Five-Year Plan (covering 2026–2030) signal continued prioritisation of manufacturing sector growth (China Briefing 2025, Guo 2025). The Plan places industrial modernisation first among development objectives, with innovation following directly after, while raising domestic consumption appears as the third priority. This sequencing reflects what the World Economic Forum characterised as China’s “recalibrated strategy” for an increasingly unpredictable global environment, emphasising “turning laboratory breakthroughs into scalable, high-value production capacity” in frontier sectors including advanced manufacturing, semiconductors, aerospace, and next-generation information technology.
Fourth, China is no longer the manufacturing sweatshop of the world. Its GDP per capita in dollar terms has tripled in the past fifteen years (World Bank World Development Indicators). The country now spends 54 per cent more on R&D in PPP-converted dollars than the European Union (OECD MSTI database). Not surprisingly then, China now exports fewer low-cost goods and more complex products. This is reflected in the complexity index compiled by Hidalgo and Hausman (2009) for Harvard’s Growth Lab, where China climbed from rank 27 in 2009 to rank 16 in 2023. In principle, such advances could encroach upon the global market share of exporters from China’s trading partners.
Writing in the Financial Times in November 2025, Robin Harding sketched the fears of some about the upgrading of Chinese exports. During conversations in mainland China, Harding posed a question to economists, technologists, and business leaders: “Trade is an exchange. You provide something of value to me, and in return, I must offer something of value to you. So what is the product, in the future, that China would like to buy from the rest of the world?” The answers were revealing: “A few said ‘soyabeans and iron ore’… Some observed that Louis Vuitton handbags are popular… ‘Higher education’ was another common answer.” Then, several economists “jumped ahead to a different point altogether: ‘This is why you should let Chinese companies set up factories in Europe.’”
Harding observed: “There is nothing that China wants to import, nothing it does not believe it can make better and cheaper, nothing for which it wants to rely on foreigners a single day longer than it has to.”<sup><a href="#note-3">[3]</a></sup> Moreover, he concludes “China is making trade impossible. If it will buy nothing from others but commodities and consumer goods, they must prepare to do the same.” We note that not a single trade statistic was marshalled in this article to support such bleak conclusions.<sup><a href="#note-4">[4]</a></sup>
Too often, commentary on Chinese export performance this year has been detached from available evidence. Where evidence is referred to, it has often been cherry-picked, and little attempt has been made to benchmark recent data releases. For example, many stories this year paint the picture of fast growth in Chinese exports. Yet, as Figure 1 shows, when year-to-date reports on the total value of Chinese exports are compared consistently across years, this year Chinese exports have only now recovered from a prior dip. As this paper was finalised the November 2025 official Chinese export data were released. This revealed that in the first 11 months of 2025, Chinese exports are now 5.1% higher than their previous peak in 2022.<sup><a href="#note-5">[5]</a></sup>
Moreover, the rate of growth of the total value of Chinese exports this year and last is slower than at the beginning of this decade (as the colour coding in Figure 1 shows). Chinese export exceptionalism during 2025 is hard to defend with such data—raising the question as to whether foreign officials should be so exercised by this year’s Chinese export dynamics.
3
Note that such statements are in contradiction with the comparative-advantage logic presented by David Ricardo (1817) which states that even a country more productive in all goods gains by importing the goods in which its relative productivity edge is smallest. As established theories of international trade make plain, gains from trade emerge because of imports, not exports. The latter are but a means to pay for the imports.
4
Our focus in this paper is on the Chinese export threat. However, we were intrigued by Harding’s conjecture on imports and have prepared an annex to this paper with pertinent exploratory import evidence.
5
Unfortunately, we do not yet have access to the granular data to update Figure 1 (which refers to the first 10 months of export data for year).
Figure 1: China’s export recovery is now complete—as measured in value terms.
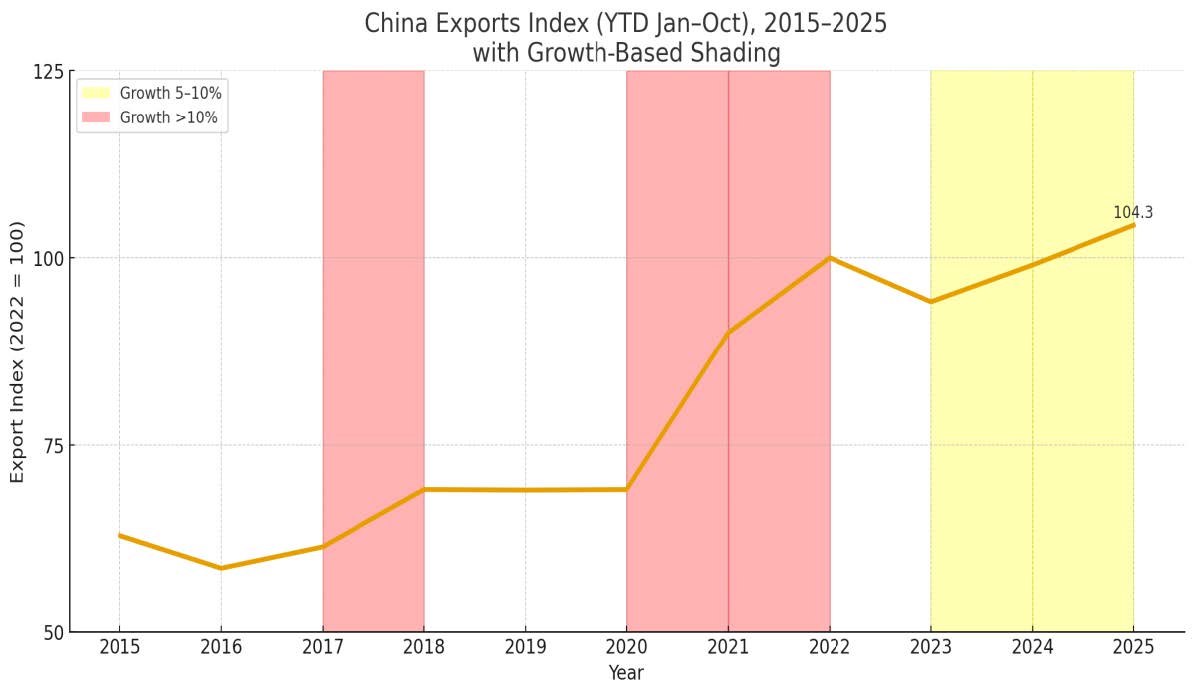
Source: Trade Data Monitor, based on official releases from Chinese Customs. Reported as the current USD amounts of total Chinese imports, with no adjustment for changes in the price level in China. Such unadjusted totals are regularly reported in the media—that is the best reason for including them here.
Some contend that it is the volume of Chinese exports, rather than their total value, that has risen so much this year. The widely regarded CPB initiative tracks Chinese export volumes, and data are available for the first nine months of this year. The annualised rate of growth of Chinese export volumes this year has been 7.1%. Figure 2 shows how unexceptional such volume growth rates have been.
Fears have been expressed this year that, such is the innovation prowess of Chinese firms, their exports now constitute a first-order threat to the competitiveness of the vanguard firms in foreign nations. A longstanding finding in the research on international trade flows is that higher-productivity firms tend to export more (Bernard et al., 2007). Therefore, ascertaining the share of a Chinese trading partner’s exports that are in the product lines where Chinese firms have demonstrated standout performance on world markets provides an indication as to the scale of the competitive threat that the latter represents to the vanguard firms in trading partners.
Against this backdrop, we marshalled evidence on the competitive threat posed by China using the most recent comprehensive global trade data available, which relates to 2023.<sup><a href="#note-6">[6]</a></sup> Our objective was to assess the extent of overlap between Chinese exports and the exports of major trading partners, contributing hard evidence to the current policy debate.
6
Complete sets of global trade data come available with a considerable lag. If findings from the complete set are at odds with noisier near-term official trade data releases, then this ought to caution against putting too much store on the latter. In Section 5, we interpret our findings on export exposure/competitive threat in light of the most recent official trade data releases.
Figure 2: This year saw Chinese export volumes rise at an annualised rate of 7.1%.
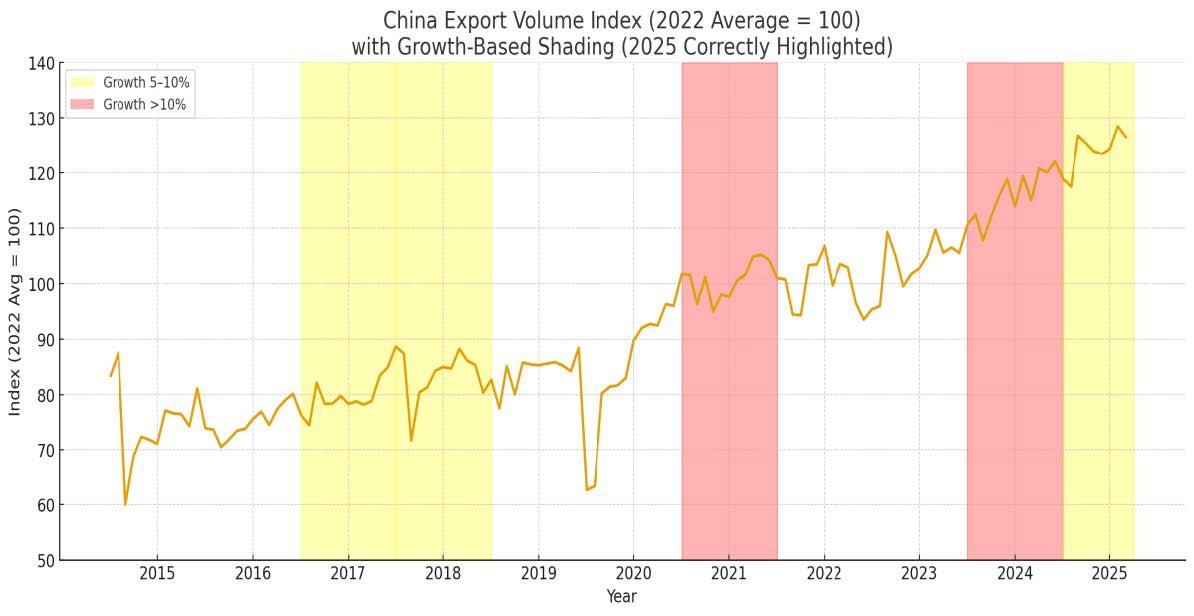
Source: World Trade Monitor, published by CPB. September 2025 edition.
The remainder of this paper is organised as follows. We describe in the next section the logic and implementation choices made as we sought to estimate the degree of overlap between the top exports of China and those of its leading trading partners. Following that, and to fix ideas, we spell out in Section 3 seven hypotheses concerning the degree of export overlap that draw upon the claims reported in the media this year. We also describe the significance of each hypothesis for business and policy audiences.
In Section 4, we present evidence on the extent of export overlap in 2015 and 2023 and then evaluate the seven hypotheses. For those readers interested in a direct cross-country comparison of the export overlap with China’s exports, this can be found in Section 5. Concluding observations on the critical role that empirical evidence can play in grounding sensible deliberations on Chinese export dynamics are provided in Section 6.
2. Empirical Approach Taken Here
To assess the competitive threat posed by Chinese exports, we analysed the degree of overlap between China's export successes and those of its major trading partners. Product overlap serves as an indicator of competitive intensity for two reasons. First, it reveals the extent of direct competition in third markets—when China and a trading partner both export the same product categories, their firms potentially compete for the same customers.
Second, countries tend to export goods in which their most productive firms operate; high overlap indicates that Chinese exports compete with a trading partner's most competitive companies—what we term their "vanguard firms." Put differently, it is hard to credit claims of a growing Chinese competitive threat in case where a trading partner’s exports are dominated by products that China does not manufacture and sell on world markets.
We employed 2023 trade data, the most recent year for which comprehensive global statistics from BACI are available, alongside 2015 data to capture changes over time. The year 2015 is the first year of implementation for China's Made in China 2025 industrial policy that targeted ten sectors, specifically information technology, robotics, aerospace, maritime equipment, advanced rail, new energy vehicles, power equipment, agricultural machinery, new materials, and biopharmaceuticals. Comparing 2015 and 2023 reveals whether China's state-directed industrial policy moved the country into greater direct competition with trading partners for sales on world markets.
Our methodology proceeded in three steps. In the first step, we identified China's top export products, ranking all products by total export value and selecting the top 25 and top 100 product categories. We used the Harmonized System at the 4-digit level (HS4), which provides sufficient granularity to identify product categories while allowing for quality and price variation within categories. For example, HS4 category 8471 covers "automatic data processing machines and units thereof", encompassing both high-end servers and basic computing equipment. This level of aggregation allows for competition within sectors at a point in time, while acknowledging that Chinese and European firms may occupy different quality segments within the same HS4 category. This design choice means our measure of export overlap almost certainly overstates the degree of competitive threat posed to the vanguard firms in China’s trading partners.
Table 1: Top 100 and Top 25 Chinese Export Goods in 2023
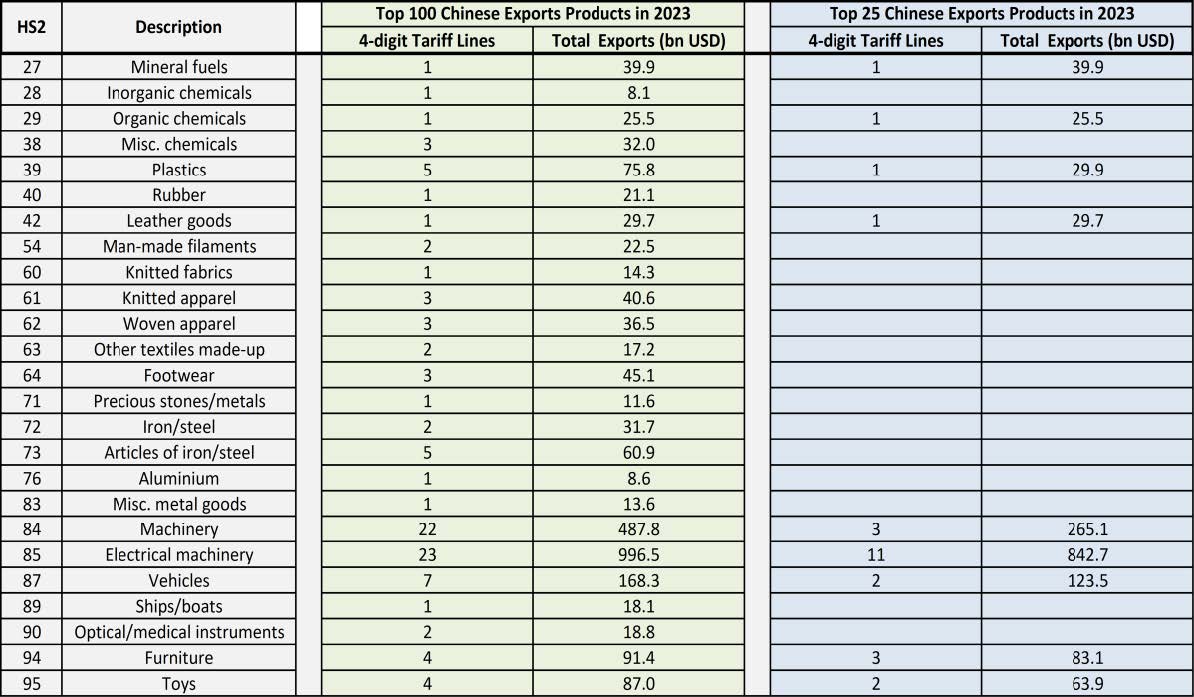
Table 1 provides information on China’s most successful exports, as measured by the total value of export revenues. We find that the 100 most successful product categories accounted for $2.4 trillion of Chinese exports and cover a wide spectrum of goods. The top 25 accounted for $1.5 trillion of exports in 2023 and were concentrated in electrical machinery, cars, furniture, and toys. Notably, the 25th most relevant Chinese product saw about $23 billion worth of exports and the 100th product about $6 billion in 2023.
In a second step, for each trading partner, we calculated what percentage of their total exports fell within China's top 25 and top 100 export categories. For instance, if 27 per cent of Germany's exports by value fall within the same HS4 categories as China's top 25 exports, this indicates that just over a quarter of German export activity occurs in product categories where China’s export strength is concentrated. This percentage serves as our primary measure of competitive overlap. Note, however, such a 27 per cent finding would also imply that nearly three-quarters of Germany’s total goods value were in products that are not in the same lines of business as China’s biggest ticket export items.
In a third step, we examined how these overlap percentages changed between 2015 and 2023, identifying which countries experienced meaningful changes in exposure to the more competitive Chinese exports.
Our measure is not the only empirical approach to gauging export overlap. More complicated indices exist, such as the Export Similarity Index by Finger and Kreinin (1979) or the Partner Similarity Index by de Soyres et al. (2025). We contend that our measure is much more straightforward to interpret.
We analysed trading partners across multiple regions and economic structures. From Europe, we examined Germany, France, Italy, Spain, the Netherlands, Belgium, the United Kingdom, and Switzerland. From North America, we analysed the United States and Canada. From Southeast Asia, we examined Vietnam, Malaysia, and Indonesia. From Northeast Asia, we analysed South Korea and Japan. From Latin America, we examined Mexico, Brazil, and Argentina. From the Middle East, we included the United Arab Emirates. From Oceania, we examined Australia. From South Asia, we included India. Russia—a major commodity exporter—was included too. Altogether, this set of countries forms the top 20 nations by goods exports in 2023.
Of particular interest here is whether the levels of export overlap between these trading partners and China are high and whether they have risen since the Made in China 2025 industrial policy came into force in 2015. A necessary condition for significant Chinese competitive threats to its trading partners’ export revenues is that the current degree of export overlap is high. A trading partner that does not export those manufactured goods in which Chinese firms excel on world markets can hardly be threatened by the Chinese export juggernaut some reckon is unfolding this year.
Changes in trading partner export overlap can be revealing too. As export overlap is a necessary condition for some competitive threat from China, rising shares of national exports in the very product lines that China excels at exporting could be taken as a sign of greater competitive threat. In contrast, falling levels of export overlap are consistent with greater international specialisation and diminished contemporary competitive threats.
However, there may be another intertemporal dynamic at work. Greater competitive threats from Chinese exports in yesteryear could reduce via firm exit and deindustrialisation in the trading partner the level of current export overlap<sup><a href="#note-7">[7]</a></sup>. It will be interesting to check if export overlap has fallen markedly in those trading partners where it is often claimed there has been a “China shock,” an outcome that presupposes some degree of product overlap at some point between China and importing country.
We do not claim that our measures of export overlap shed light on every aspect of contemporary Chinese export performance. Several points are worth making here. First, our overlap metrics measure competitive exposure but do not reveal whether Chinese products are also displacing a trading partner's exports, whether both countries' exports are growing in expanding markets, or whether quality and price differentiation allow export sales coexistence.
Second, further investigation would be needed to determine which product categories are most responsible for the overlap. The unit of analysis of our export overlap statistic is at the national level, which has its uses and drawbacks. Third, given our focus is on exports not imports, this analysis cannot assess what might be termed the mercantilist asymmetry—Harding's claim that "China wants to sell everything but buy nothing." Fourth, the delayed release of a complete set of UN trade data prevents a comprehensive assessment of the potential redirection of Chinese exports now that they face much higher U.S. import tariffs barriers.
7
In this regard, see the later empirical findings for Canada and Russia.
Box: Export overlap computation
Data source: BACI database—which in turn is a cleaned-up version of the UN Comtrade database. Trade flows for 2015 and 2023 were used.
Product classification: Harmonized System 2017 revision, 4-digit level (HS4), comprising 1,224 product categories. HS4 provides greater detail than HS2 (97 categories) whilst avoiding the granularity of HS6 (5,052 categories).
China's top export categories: Ranked by total export value (free on board) in US dollars. Together, the top 25 export categories account for approximately 45 per cent of China's total exports in 2024; the Top 100 categories account for approximately 75 per cent. Such statistics indicate how few product lines account for the overwhelming proportion of Chinse export dynamism.
Overlap calculation: For each trading partner, we summed the export value of all products appearing in China's top 25 (or top 100), then divided by the partner's total exports.
Formula:
Overlap =100 x Σ(Partner exports in China's top N categories) / Partner's total exports.
Country coverage: Analysis covers the top 20 trading nations by 2023 export volume, representing approximately 80 per cent of global trade ex-China.
Limitations: HS4 classification cannot capture quality differences within categories. Trade data reflects gross exports, not value added, potentially overstating overlap for countries engaged in processing trade. Re-exports through entrepôt centres may create measurement concerns.
Graphs: Figures 3 and 4 show the main findings, ranking countries in descending order of export overlap.
3. Hypotheses Considered and the Commercial and Policy Stakes
Based on the recent media and official commentary, and to fix ideas, we formulated seven hypotheses that relate to the extent and changes in trading partner export overlap with China. To demonstrate the relevance of each of these hypotheses, we describe their commercial and policy significance.
Hypothesis 1: Across-the-board a growing competitive threat from China
The hypothesis: The degree of export overlap of China’s trading partners was higher in 2023 than in 2015 driven by the implementation of the Made in China 2025 industrial policy.
Commercial stakes: If overlap has increased as opposed to unchanging, then this is consistent with an intensifying competitive threat to trading partners’ export revenues. For some, this would indicate that China is not gradually integrating into global markets through traditional comparative advantage (which would lead to greater specialisation and falling export overlap) but systematically capturing market share through scale, subsidisation, and technological advancement. For businesses, growing overlap implies that competitive pressure will worsen without state intervention. On this view, waiting for market forces to restore equilibrium will fail because state-directed industrial policy is overriding market signals.
Policy stakes: Von der Leyen's characterisation of 2025 as an "inflection point" and Xi Jinping's acknowledgement of a "critical juncture" suggest both recognise the current moment as pivotal. If overlap is increasing, it may validate this urgency and justify immediate policy responses rather than continued dialogue and negotiation. The European Union's shift from describing China as a "strategic partner" (before 2019) to a "systemic rival" (2019 onwards) to current confrontational postures (tariffs, investigations, technology transfer demands) might be vindicated by evidence of increased export displacement. This pushes European policymakers away from von der Leyen's preferred approach—demanding Chinese policy changes and waiting for rebalancing—towards more immediate, confrontational measures such as comprehensive tariffs, investment screening, and industrial subsidies.
Hypothesis 2: European Industrial Vulnerability and the "Inflection Point"
The hypothesis: European countries, particularly core manufacturing economies such as Germany, France, and Italy, currently show high overlap with China's top exports. Furthermore, this overlap has increased between 2015 and 2023, on account of China's Made in China 2025 industrial policy.
Commercial stakes: If confirmed, this hypothesis reveals that many European firms compete with Chinese exporters in those product categories representing its greatest export strength. High overlap means that Europe's vanguard firms—companies like Siemens in industrial machinery, BASF in chemicals, or Volkswagen in vehicles—face Chinese competition not only in the Chinese domestic market but also in third markets. Rising export overlap indicates that China's comparative advantage is expanding into sectors where European firms have dominated, threatening the viability of Europe's manufacturing base.
Policy stakes: Von der Leyen's warning about an "inflection point" and her demand for "rebalancing" require validation. If export overlap is high and rising, then European policymaker concerns may be comprehensible, if not economically defensible. This hypothesis tests whether European concerns about growing competitive threats are in line with available export data.
Hypothesis 3: Germany—The Epicentre of European Vulnerability
The hypothesis: German vanguard firms are at greater risk. Here that means Germany has the highest overlap with China's top 25 and top 100 exports among all European countries analysed. A secondary hypothesis is that Germany's overlap has increased between 2015 and 2023 more than any other European nation, indicating increased vulnerability as the Made in China 2025 industrial policy rolled out. A tertiary hypothesis is that the ratio of Top 100 or Top 25 overlap is higher for Germany than for other European nations, suggesting a greater competitive threat across a broader product range.
Commercial stakes: As noted by Robin Harding, Goldman Sachs identified Germany as suffering the most from this year’s Chinese export increase, forecasting a measurable drag on German economic growth. Germany's export-led growth model depends on high-quality capital goods—machinery, vehicles, chemicals, precision instruments—sold globally. These are the some of the sectors that China's industrial policy has targeted. If overlap is high and rising, it indicates that China threatens not Europe's periphery but its industrial core. The implications extend beyond Germany: this country represents approximately one-quarter of EU GDP and has been the engine of European industrial competitiveness.
If Germany's vanguard firms face the greatest competitive pressure, some might be tempted to argue that the entire European industrial ecosystem is at risk. Supply chains that depend on German precision machinery, chemical inputs, or automotive components would be at risk and might need to restructure. Ultimately, the question is whether high per-capita income economies such as Germany can sustain prosperity through manufacturing as Chinese exports capture greater shares of world markets.
Policy stakes: Germany's position as both the EU Member State most threatened by Chinese competition and the Member State most dependent on China trade complicates policymaking at the national and European level. While German firms have investments in China and depend on Chinese demand, those same firms also face Chinese competitors in third markets and in Europe itself. This creates divergent pressures: protect German industry through EU-wide trade defence measures or maintain access to the Chinese market by avoiding confrontation. This hypothesis tests the severity of Germany's competitive exposure to China’s successful exports, a factor that might influence EU policy towards Chinese commerce, including steps to de-risk or decouple certain trade with China.
Hypothesis 4: North America—Distance Reduces the Chinese Export Threat
The hypothesis: As the geographic distance between China and North America is greater than that between Beijing and Europe<sup><a href="#note-8">[8]</a></sup>, the degree of competitive threat to North America is lower. Moreover, the change in export overlap between 2015 and 2023 is smaller for the North American economies than European peers. Geography affords North America a stronger shield against the Made in China 2025 industrial policy.
Commercial stakes: Frequently it is contended that the United States has undergone deindustrialisation; manufacturing now represents approximately 11 per cent of US GDP compared with 20 per cent in Germany. American comparative advantage lies in services, software, aerospace, and advanced semiconductors—sectors where barriers to Chinese competition remain higher due to either the nature of the item in question (services require proximity and trust), policy interventions (semiconductor export controls) or economies of scale (aerospace). The commercial implication is that the United States and Europe face different competitive challenges from China. Lower competitive threats to American manufacturers diminish corporate pressure for an aggressive stance against Chinese industrial policy, implying that policy analysts and journalists have to push “China threat” narratives. American firms with significant commercial presence in China would be even less likely to campaign publicly and aggressively against Chinese industrial policy moves.
Policy stakes: If the United States and the European Union face different competitive threats, their strategies towards China may tend to diverge. The United States prioritises technology controls, semiconductor export restrictions, and artificial intelligence governance—areas where it retains technological leadership but fears Chinese catch-up. The European Union prioritises trade defence, other market access restrictions and subsidy-support for firms that have lost ground to Chinese rivals. This divergence undercuts efforts to coordinate policy across the Atlantic. If confirmed, the hypothesis suggests that Western coordination on China requires acknowledging different vulnerabilities and tailoring responses accordingly, rather than assuming a unified transatlantic interest.
8
The distance between Shanghai and Berlin is about 8,400km while Los Angeles is about 10,400km from Shanghai.
Hypothesis 5: Southeast Asia—The "China+1" Paradox and Trade Diversion
The hypothesis: Proximity and similarity in level of development with China imply that Southeast Asian nations exhibit very high levels of export overlap with China's most successful export categories. Moreover, as a result of the first US-China trade war, the relocation of some production from China to ASEAN nations resulted in an increase in the export overlap between 2015 and 2023.
Commercial stakes: The growth in Chinese exports to Southeast Asia—up 14.3 per cent in the first 10 months of 2025 compared to 2024—raises a question: does this represent transhipment (China routing goods through Southeast Asia to evade U.S. tariffs), competitive pressure (China and ASEAN exporters competing for the same third markets), or complementarity (China supplying inputs for ASEAN manufacturing)? High levels of export overlap would suggest the first two interpretations rather than the third.
If ASEAN countries export similar products to China, Western firms pursuing "China+1" strategies—diversifying supply chains by moving production from China to Vietnam or Thailand—may be shifting to suppliers who face identical Chinese competitive pressures. The commercial implication is that supply chain diversification achieves geographic redistribution towards economies facing lower US import tariffs, but not competitive insulation.
Suppose ASEAN manufacturers compete with Chinese firms on cost and scale; if Chinese factories have superior productivity, access to subsidised inputs, and domestic market scale advantages, ASEAN alternatives may prove commercially unviable without tariff advantages. The "China+1" strategy assumes that moving production out of China reduces dependence; high overlap would suggest it merely relocates the competition.
Policy stakes: ASEAN countries may face a choice between accepting Chinese economic integration and benefiting from proximity to Chinese supply chains, or aligning with American trade and security partnerships and enduring Chinese economic pressure. High export overlap makes this choice more acute because ASEAN economies have fewer export revenues where their firms do not go head-to-head with Chinese rivals. The policy question becomes whether the West can offer ASEAN countries market access, investment, and technology transfer to compensate for potential Chinese retaliation—and whether ASEAN products can compete without Chinese inputs.
Hypothesis 6: Northeast Asia—The Technological Squeeze
The hypothesis: Due to geographic proximity and extensive foreign direct investment in China, South Korea and Japan exhibit the highest overlap with China's top exports. Moreover, their overlap has increased between 2015 and 2023 despite growing economic security concerns in Seoul and Tokyo.
Commercial stakes: South Korea and Japan have industrial structures similar to Germany's—concentrated in high-quality machinery, electronics, vehicles, and chemicals. They also participate in Chinese-centred supply chains, both as suppliers of components and capital equipment and as customers for Chinese intermediates. High and rising overlap would indicate that geographic proximity multiplies competitive pressure. South Korean and Japanese firms face Chinese competition in third markets (both selling electronics to Europe) and in their own markets (Chinese vehicles entering Japan and South Korea). Chinese goals of achieving self-sufficiency in semiconductors, displays, and batteries threaten South Korean firms such as Samsung and LG, while Chinese advancement in machinery and robotics threatens Japanese firms such as Fanuc Corporation.
The commercial stakes are compounded for firms in these countries which have an intermediate position among competitors: too advanced to compete on cost with China, yet not ahead in frontier technologies to escape competitive pressure. Unlike the United States, which maintains technology leadership in software and advanced semiconductors, Japan and South Korea occupy the "squeezed middle"—those manufacturing sectors where China is catching up.
Policy stakes: Japan and South Korea face triple pressure: Chinese competition, US demands for technology export controls, and domestic political pressure to protect industries. Both countries have implemented semiconductor export restrictions targeting China, balancing American security demands against commercial considerations.
If export overlap is high and rising, it validates these countries' strategic concerns while complicating their policy responses. Regional trade agreements such as the Regional Comprehensive Economic Partnership (RCEP) which include China, Japan, South Korea, and ASEAN, premised on mutual economic benefit from integration. High overlap may undermine this premise—integration may amplify competitive displacement rather than creating complementary specialisation.
Hypothesis 7: Clustering based on Industrial Structure
The hypothesis: Export overlap patterns cluster by industrial structure: high per-capita income manufacturing powerhouses (Germany, Japan, South Korea) in one group, Anglo-American economies (US, Canada, UK) in another, ASEAN economies in a third, and peripheral European economies in a fourth. The clustering is more pronounced in 2023 than in 2015, and the between-cluster differences have increased.
Commercial stakes: If clustering is tight, it suggests countries with similar industrial structures face similar Chinese competitive pressures regardless of geography. For example, higher per-capita income manufacturing powerhouses face a similar squeeze from Chinese moves up the value chain. ASEAN countries face a similar squeeze from Chinese manufacturing scale and efficiency in labour-intensive products. The sense that China competes “everywhere” in every stage of the production chain grows.
Policy stakes: If clustering is by industrial structure not geography, then US-EU coordination on China policy is difficult (different industrial structures mean different interests), while coordination and exchanges between Germany, Japan, and South Korea makes more sense (similar industrial structures mean similar threats). On this hypothesis, ASEAN countries will have similar policy responses despite different political systems. The hypothesis tests viability of alliances based on geography (e.g., the EU) versus those based on industrial structure.
4. Empirical Findings and Assessment of The Hypotheses
Figures 3 and 4 reveal the computed levels of export overlap for 2015 and 2023. Figure 3 represents the degree of export overlap with China’s top 25 largest export categories, whereas Figure 4 shows the overlap for the top 100 Chinese exports. In what follows we assess each hypothesis in light of this empirical evidence.
Hypothesis 1: Across-the-board a growing competitive threat from China
From 2015 to 2023, export overlap increased for some emerging and middle-income trading partners of China. Many economies witness little change in export overlap between 2015 and 2023 and when considering the Top-100 as well as the Top-25 exports. The competitive threat from China has not risen across the board in the years after the Made in China 2025 industrial strategy came into force. Sweeping generalisations cannot be supported empirically.
Figure 3: Export overlap with the 25 largest Chinese export categories in 2023.
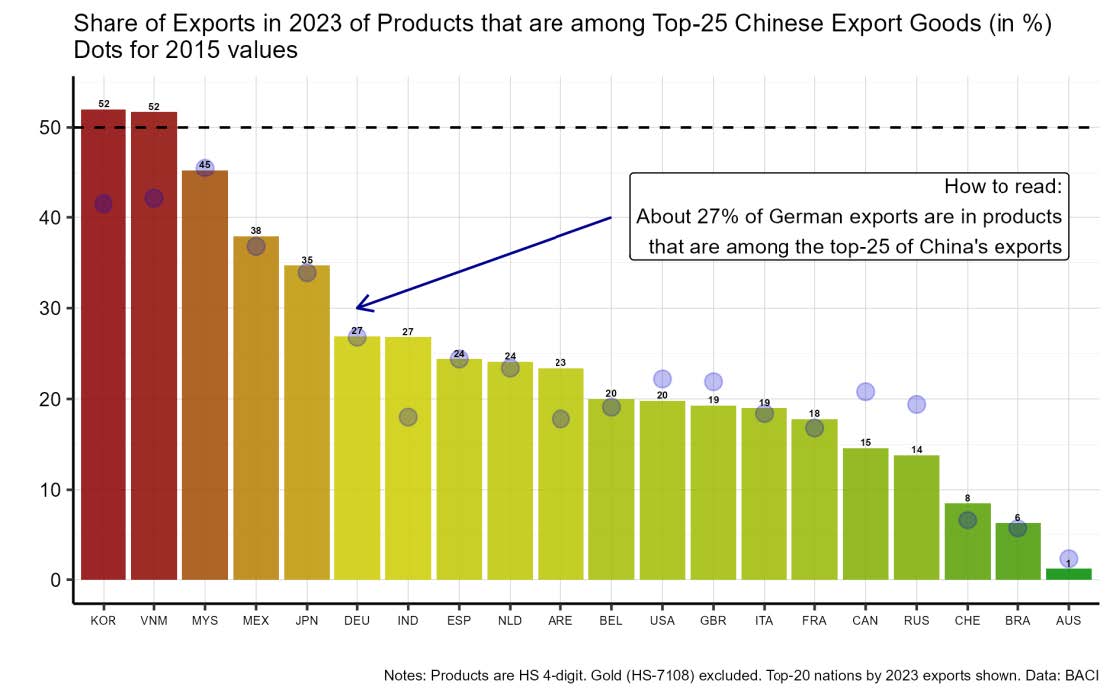
Figure 4: Export overlap with the 100 largest Chinese export categories in 2023.
Hypothesis 2: European Industrial Vulnerability and the "Inflection Point"
Less than 30% of the exports of every European nation considered here compete with the 25 most successful Chinese export lines. For many European economies, including France, Italy, and the United Kingdom, the overlap is below 20%. When it comes to the top 100 Chinese exports, the overlap percentages increase—but for only one European nation half its exports are in competition with the top 100 Chinese exports. These results imply that large swathes of European exports do not compete with the most successful Chinese counterparts.
Export overlap increased between 2015 and 2023 for some European nations, but only marginally. Germany's Top-100 overlap rose by one percentage point from 50 to 51 per cent, whereas its Top-25 overlap was unchanged at 27 per cent. France experienced a rise in Top-25 overlap from 17 per cent to 18 per cent, though its Top-100 overlap increased from 36 per cent to 39 per cent. Italy showed small increases too, from 18 per cent to 19 per cent for Top-25 and from 45 per cent to 46 per cent for Top-100. The Netherlands increased from 23 per cent to 24 per cent for Top-25 and from 38 per cent to 43 per cent for Top-100. Such tiny changes in export exposure of European economies over eight years are hard to square with claims of broad-based threats to living standards from Chinese exports.
Hypothesis 3: Germany—The Epicentre of European Vulnerability
Germany records the highest export overlap amongst European nations at 51 per cent for Top-100 products. Comparable export overlap statistics range from 46 per cent to Italy to as low as 20 per cent for Switzerland. Such findings confirm part of the third hypothesis laid out earlier.
The implementation of China’s Made in China 2025 strategy, however, has coincided with little change in Germany’s export overlap. Top-100 overlap increased by one percentage point while Top-25 overlap remain unchanged. It is difficult to paint a convincing picture of threats to German manufacturing with such statistics.
Nor does Germany compete with China across a broader product range than other European nations. Germany's ratio of Top-100 to Top-25 overlap stands at 1.89, less than the comparable ratios for Britain, France, Italy, and Switzerland. Such findings do not support claims of exceptional German vulnerability.
Hypothesis 4: North America—Distance Reduces the Chinese Export Threat
In 2023, the United States exhibited a Top-25 export overlap of twenty per cent and Top-100 overlap of forty per cent. These figures fall well below Germany (27 per cent and 51 per cent) and are fairly similar to Italy (19 per cent and 46 per cent for Top-100). Moreover, the current level of US export overlap is lower than South Korea (52 per cent and 71 per cent, respectively), Japan (35 per cent and 65 per cent), and Mexico (38 per cent and 67 per cent). Canada shows even lower overlap than the United States at 15 per cent for Top-25 and 26 per cent for Top-100.
Canada and the United States have both seen their export overlap with China fall since 2015, with Canada’s falling much further than the United States. These findings are consistent with the English-speaking North American nations specialising in economic activities that compete less often in world markets with China’s successful exporters. It is possible that prior imports from China contributed to this increased specialisation in North America through firm contraction and exit. Even if that is true, a byproduct of deindustrialisation in the past is reduced export overlap now and diminished competitive threat to vanguard American and Canadian firms.
Hypothesis 5: Southeast Asia—The "China+1" Paradox and Trade Diversion
Indonesia, Malaysia and Vietnam record divergent paths for levels of export overlap with China. Vietnam has both the highest export exposure in 2023 among these three ASEAN nations and racks up a ten percentage point increase in export exposure (on both the Top-25 and Top-100 metrics).
Malaysia maintains its export overlap with China at similar levels, seeing no growth in overlap despite the US-China trade war and the implementation of the Made in China 2025 industrial policy. Indonesia sees its export overlap grow over time, enabling it to narrow the gap with its two ASEAN partners. Such findings call into question the wisdom of drawing conclusions for ASEAN as a whole about the threat to their firms from Chinese upgrading. A further complication is that Chinese investments in ASEAN may be skewing the export overlap data but evidently not sufficiently to raise reported totals everywhere.
Hypothesis 6: Northeast Asia—The Technological Squeeze
In 2023, South Korea had a 52 per cent export overlap with the Top-25 exports of China; its Top-100 overlap stood at 71 per cent. Japan’s overlap statistics stood at 53 per cent and 65 per cent, respectively. While similar, the trajectories for both nations since 2015 have diverged. Japan saw modest increases in its export overlap in contrast to the significant rises recorded for South Korea (Top-25 export overlap was up 10 percentage points and Top-100 export overlap was up 7 percentage points). If anything, competitive threats to South Korea’s vanguard firms from Chinese rivals have intensified significantly more than for Japanese counterparts, at least on the metrics presented here.
Hypothesis 7: Clustering based on Industrial Structure
Our export overlap statistics reveal some degree of clustering but proximity to China cannot be decisive. Korea and Vietnam have the highest degree of export overlap with China in 2023. However, in third position (on both the Top-25 and Top-100 export goods metrics) is Mexico, which is located on a different continent.
Despite having a significant manufacturing sector, Germany’s level of export overlap falls far short of that of G20 peers, Japan and South Korea. Still there are anomalies that defy simple generalisation: When compared with Germany and East Asian manufacturing powerhouses, Switzerland has an unusually low levels of export overlap.
What is clear is that the commodity exporters (Australia, Brazil, Canada, Russia, and UAE) have very low levels of export overlap with China, suggesting that the uneven allocation of resources across the globe is a relevant factor. Identifying such clusters is valuable as it may reveal peer economies that have faced similar levels of competitive export threats from China.
5. Comparing export overlap across China’s trading partners
The purpose of this section is to use the export overlap metrics that we have developed to assess the degree of competitive threat to vanguard firms in China's trading partners. The raw data underlying Figures 3 and 4 are reported in Table A1 in the Appendix. We analyse that table to make a number of cross-country inferences about the degree of competitive threat faced by different economies.
Competitive Threat Assessment in 2023: Defies Generalisation
The first observation relates to the degree of competitive threat in 2023, the last year for which a full set of global trade data was available. Looking across the 20 Chinese trading partners studied here, the median export overlap for the top 25 products that China exports is 21.5%. For the top 100 products that China exports, the median overlap is 41.0%. The near-doubling of median overlap when moving from top-25 to top-100 products indicates that China's competitive advantage extends well beyond its largest 25 export categories, suggesting considerable depth in export capabilities across a broader product range.
Looking beyond the medians, we can see that in 2023 just two countries out of 20 had an export overlap exceeding 50% when it comes to the top 25 products that China exports. This means that for 18 out of 20 trading partners, at least half of the goods that they export do not overlap with China's top 25 most competitive export products. We also note that 13 out of the 20 trading partners studied here had an export overlap of less than 25% when examining the top 25 Chinese exports. This means for 13 of the 20 countries that we have studied, more than three-quarters of their exports are not in product lines where China has the most success in exporting to world markets. Across the 20 Chinese trading partners studied here, the export overlap with China’s top 25 exports varies from 1% to 52%.
Turning to the top 100 products that China exports<sup><a href="#note-9">[9]</a></sup>, only six out of 20 trading partners have export overlaps of 50% or more. This means that 14 out of the 20 trading partners have most of their exports in products that are not in the top 100 that China most successfully exports around the world. While the number of countries facing substantial competitive pressure triples when moving from top-25 to top-100 metrics (from 2 to 6 countries), the majority of trading partners remain relatively insulated. The mismatch in the products exported between China and these 14 trading partners is stark.
To the extent that China's vanguard firms are concentrated in this top 100 export products, it suggests that the vanguard firms of these trading partners are concentrated in sectors where China is not a highly successful exporter onto world markets. In order for there to be a Chinese competitive threat to vanguard firms in its trading partners, on the assumption that vanguard producers have higher productivity and tend to be exporters, there would need to be exports from both China and the trading partner in the product in question. Such matches are rarer than many analysts, journalists, and policymakers may realise.
Moreover, the substantial increase in overlap when broadening from top-25 to top-100 products suggests that China's competitive challenge manifests across a wide product spectrum rather than in a narrow set of sectors, with different trading partners facing competitive pressure in different product categories. Indeed, the wide variation in export overlap across the 20 Chinese trading partners studied here cautions against statements that Chinese superstar exporters represent a pervasive competitive threat to all its major trading partners.
9
Again, the variation in export overlap on this metric is significant: ranging from a minimum of 3% to a maximum of 76%
Made in China 2025 Implementation: Limited Impact on Export Patterns
We turn now to the changes in the export overlap statistics between 2015 and 2023. What is of interest here is whether the export overlap has grown significantly in the years following the implementation of the China 2025 strategy. Looking across the 20 trading partners studied here, the median export overlap when calculated using the top 25 Chinese exports has grown just one percentage point. The median change for the top 100 products is identical at one percentage point, indicating that the temporal stability observed in China's most concentrated export strengths extends equally across this broader product range.
When one looks at the individual country performance, 11 countries saw their top 25 export overlap metric increase. Of those 11, only four countries saw the export overlap increase by 3 percentage points or more. This means 16 countries experienced decreases, no change, or small increases in the degree to which their country's exports compete in the same product lines where China has a standout position.
Our results also show that six countries saw their export overlap metric fall, and three countries saw their export overlap fall by 3 percentage points or more. It is possible that in those three countries—Canada, the United Kingdom, and Russia—prior Chinese exports might have caused de-industrialisation and increased specialisation, resulting in less overlap. However, as two of these three nations are major commodity exporters, the degree of competition with Chinese manufacturers in the first place was limited to start with.
When we turn to the top 100 Chinese export success stories, we find that export overlaps calculated on that basis yield the following results. First, 11 countries saw their export overlap statistic increase. Seven of them saw an increase in excess of 3 percentage points. This means that 13 of our 20-country trading partner sample did not see a significant increase in potential competition with Chinese firms in world markets.
When it comes to the top 100 Chinese products, seven countries saw their export overlap metric fall, and three of those countries saw falls of 3 percentage points or more (Canada, Russia, and the United States). This does not constitute widespread evidence of Chinese exports causing deindustrialisation and export loss. In the face of greater Chinese competition, it is evident that droves of vanguard firms in these three and other economies have not given up exporting.
Stable Export Overlaps: Implications for the Policy Debate
The overall impression given by these statistics is that the export overlap metrics are fairly stable over time. Meanwhile, China’s exports continue to rise, which some attribute more to Chinese public policy than to the ingenuity of its managers and workers. What do our findings mean for current concerns about Chinese export competition?
The very fact that these trading partners' export overlap metrics have not changed much since the Made in China 2025 strategy began to be implemented in 2015 has important implications for contemporary policy debates. As exports cannot happen without production, surely the findings presented here raise important questions as to whether Beijing's far-reaching industrial policies have created the competitive threats to its trading partners that many assert. Perhaps those making such claims point to salient examples of companies in trouble. The evidence presented here suggests that those examples are more likely to be outliers than representative of the market dynamics actually underway.
The similar patterns of stability observed across both top-25 and top-100 metrics reinforce this finding, suggesting that industrial policy effects, if present, have not been sufficiently powerful to prevent trading partners from earning considerable export revenues in the products where China has demonstrated export success. To repeat, if the Made in China 2025 industrial policy has wiped out large swathes of manufacturing firms in trading partners, it should have wiped out their exports too. Given that has not happened perhaps the question should be turned around: If China’s industrial policy created superstar exporters, then what steps did vanguard firms in trading partners take to maintain both their competitive position and exports? Perhaps there is much to be learned from the firms that quietly and effectively rose to the challenge of Chinese competition?
6. Conclusion: Evidence Provides the Reality Check for Narrative
Our goal here is to show how publicly available international trade data can inform the polarised debate on the trade effects of China’s industrial rise. Commentary too often rests on unchecked and unwarranted assumptions and worse mere assertions. The export overlap metric developed here provides an easy-to-explain gauge of exposure to Chinese exporting prowess that can be compared across economies and over time; that can be replicated with ease; and that is transparent in construction.
Our approach allows a more structured, data-driven assessment of the scale of the competitive threat posed by Chinese exports. The payoff from doing so became apparent when we evaluated the performance of seven hypotheses formulated on the basis of commentary and policymaker statements that we’ve read this year. Of the seven hypotheses considered, two were fully validated, three were only partially validated, and two were rejected outright by the data.
Available evidence shows that exposure to Chinese exports differs significantly across economies and regions, defying generalisations about the pervasive nature of the Chinese competitive threat in manufactured goods. The latest available comprehensive trade data records a 76 per cent overlap with Chinese Top-100 export products for Vietnam, nearly double the United States’ exposure at 40 per cent and 25 times larger than the 3 per cent overlap recorded by Australia.
Our findings challenge certain narratives heard this year. Claims of rising competitive threats on European industry do not sit well with small changes in export overlap for Germany, France, Italy, Spain, Belgium, and the United Kingdom over the eight-year period from 2015 to 2023. But does this stability contradict President von der Leyen's characterisation of 2025 as "an inflection point" in EU-China relations?
One good reason for doubting President von der Leyen’s claim comes from the stability of the Top-25 and Top-100 Chinese export product categories. Of the Top-25 (4-digit HS) product categories exported by China in 2023, 22 of them were still in the Top 25 in 2025<sup><a href="#note-10">[10]</a></sup>. Of the Top-100 export 4-digit HS product categories in 2023, 89 were still in the Top 100 in 2025. Such statistics imply that the export patterns prevailing in 2023 are very likely to be similar to those prevailing this year.
Moreover, the total value of the Top-25 and Top-100 Chinese exports to the world grew slower from year-to-date 2024 to year-to-date 2025 than for all Chinese exports (5.20% and 4.71% compared to 5.35%, respectively). This implies that the growth of Chinese exports to world markets this year is not focused on the products where it has established competitive advantages.
However, when a comparable analysis focuses exclusively on Chinese exports to the European Union, this year witnessed 9.23% export growth in the Top-25 product categories from China to the EU and the Top-100 saw 7.57% growth. As overall Chinese exports to the EU grew 7.47% this year (compared to the same period in 2024), the differential growth rate implies faster export growth to the EU in China’s most successful export products. The question is whether that is sufficient evidence to constitute an “inflection point”.
Perhaps one way of understanding Mrs von der Leyen’s point is not to think in terms of incremental growth rates but in terms of a “boiling frog” problem: at some point the Chinese competitive threat reaches a tipping point. While this interpretation might have merit, it requires European policymakers to perceive thresholds that cannot be found in aggregate trade data or are unavailable to third party observers.
By contrast, Southeast Asian hosts of investments associated with China+1 corporate strategies have export portfolios that strongly overlap with China. Vietnam, Malaysia, and Indonesia record higher exposure than many higher per-capita income countries considered here. The focus on European exposure also overlooks the scale of the competitive threat faced by South Korea and Japan—raising the question of how anxious European corporate executives and policymakers could learn from China’s neighbours in Northeast Asia.
The question of increased export exposure over time also has implications for narratives invoking “inflection points” and “critical junctures”. The extent of export overlap with China has changed little since 2015 in China’s trading partners in Western Europe, North America, and Latin America. In fact, Canada and Russia show declines in export overlap. Moreover, large shares of many nations’ exports do not compete in third markets with rivals from China—this was the case in 2015 and remained so in 2023. Made in China 2025 industrial policies have not changed this. Whether the 15th Five-Year Plan will raise competitive pressures from Chinese firms remains to be seen and, with the metrics developed here, can be tracked by China’s trading partners.
10
Calculation based on the first 10 months of Chinese export data in this year and in 2023.
7. Sources consulted in preparing this paper
Bernard, Andrew B., J. Bradford Jensen, Stephen J. Redding, and Peter K. Schott (2007). “Firms in International Trade.” Journal of Economic Perspectives 21(3): 105–130.
China Briefing (2025). "China's 15th Five-Year Plan Recommendations – Key Takeaways for Foreign Businesses." Dezan Shira & Associates, 28 October.
de Soyres, F., Fisgin, E., Gaillard, A., Santacreu, A. M., and Young, H. (2025). “From Partners to Rivals: The Global Trade Dynamic.” Working Paper.
Financial Times. (2025). “The FT View: The Meaning of China’s $1 trillion trade surplus.” 9 December
Finger, J. M., and Kreinin, M. E. (1979). “A measure of ‘export similarity’ and its possible uses.” Economic Journal 89(356), 905–912.
Foy, Henry and Joe Leahy (2025). "EU calls for 'negotiated resolution' with China in face of US tariffs." Financial Times, 8 April.
Gaulier, Guillaume, and Soledad Zignago (2010). “BACI: International Trade Database at the Product-Level. The 1994–2007 Version.” CEPII Working Paper No. 2010-23.
Guo, Junpei (2025). "How China's 15th five-year plan signals a new phase of strategic adaptation." World Economic Forum, 30 October.
Hale, Thomas and Haohsiang Ko (2025a). "China's exports fall for first time since 'liberation day' trade tariffs." Financial Times, 7 November.
Hale, Thomas and Haohsiang Ko (2025b). "Chinese exports grow at slowest rate in 6 months." Financial Times, 8 September.
Hale, Thomas and Leahy, Joe (2025). "China’s trade surplus tops $1tn for first time." Financial Times, 8 December.
Harding, Robin (2025). "China is making trade impossible." Financial Times, 26 November.
Hidalgo, César A., and Ricardo Hausmann (2009). “The Building Blocks of Economic Complexity.” Proceedings of the National Academy of Sciences 106(26): 10570–10575.
Ip, Greg (2025). “World Pays a Price for China’s Growth.” Wall Street Journal. 8 December.
McMorrow, Ryan, Joe Leahy, and Henry Foy (2025). "Ursula von der Leyen tells Xi Jinping EU-China ties are at 'inflection point'." Financial Times, 24 July.
Melitz, Marc J. (2003). “The Impact of Trade on Intra-Industry Reallocations and Aggregate Industry Productivity.” Econometrica 71(6): 1695–1725.
OECD. “Gross domestic spending on R&D.” OECD Data. https://www.oecd.org/en/data/indicators/gross-domestic-spending-on-r-d.html
Ricardo, David (1817). “On the Principles of Political Economy and Taxation.” London: John Murray.
Sandlund, William, Delphine Strauss, and Ian Smith (2025). "Will Chinese exports continue to defy Trump's trade war?" Financial Times, 3 August.
World Bank. “GDP per capita (current US$) – China.” World Development Indicators. https://data.worldbank.org/indicator/NY.GDP.PCAP.CD?locations=CN
Note: Not every source listed here was cited in the text. Each source informed the arguments or computations made.
Annex: An exploratory analysis of the Harding Conjecture.
In a recent column, Robin Harding observed: “There is nothing that China wants to import, nothing it does not believe it can make better and cheaper, nothing for which it wants to rely on foreigners a single day longer than it has to.” Does available evidence support this claim? One way to check is to examine in how many product lines China is systematically importing less of year-on-year.
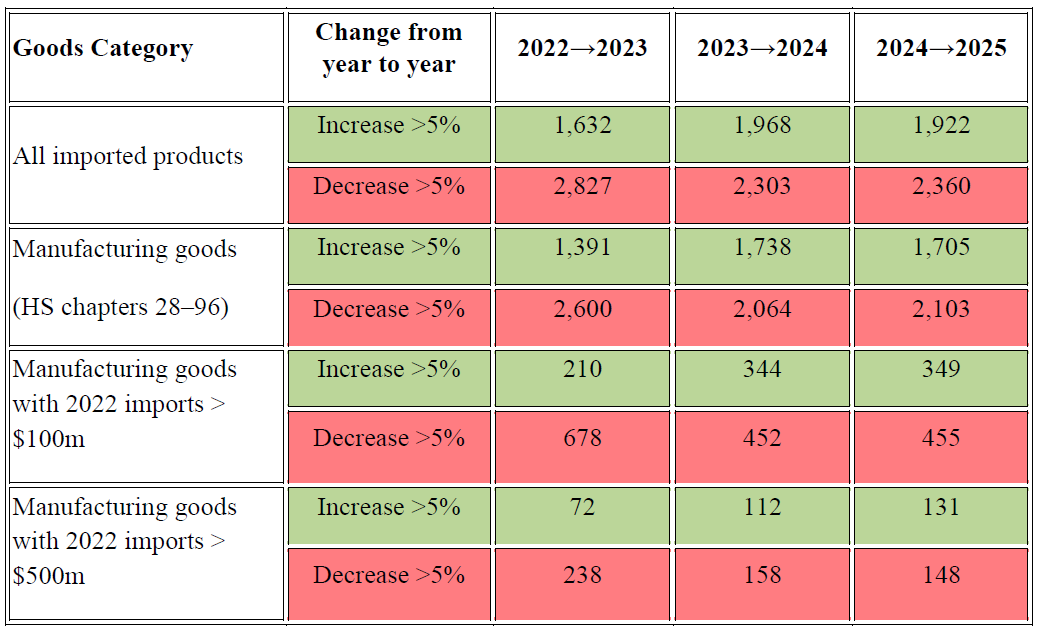
So far this year official Chinese import data is available for the months January to October. To facilitate a direct comparison with earlier years, we compared the year-to-date totals for 2025 with the comparable months in 2022, 2023, and 2024. Comparing adjacent years, we counted the number of 6-digit product categories where the total value of Chinese imports fell 5% or more. To provide a benchmark, we also calculated the total number of product categories that witnessed a 5% or more expansion in the total value of Chinese imports.
We repeated these calculations for all goods, all manufacturing goods, and for manufactured products where imports were a big-ticket item in 2022 (taken as either a $100m or $500m import bill). The following calculations are based entirely on official Chinese import data, which is carefully processed by Trade Data Monitor, the leading international trade data provider. Results are presented below for the absolute number of product lines in each category and adjacent years and in percentage form.
One finding stands out. No matter the goods category examined and the years considered, in every case the number of products where China is importing 5% less exceeds the number where its imports growth 5% in adjacent years. Furthermore, the number of products witnessing 5% or more reductions was greatest in 2023 and markedly less since. Interestingly, the number of goods categories where Chinese sourcing from abroad rises 5% or more in value tends to increase over time, especially for bigger ticket items.
Number of product lines witnessing 5% or more changes in total import value
Percent of product lines witnessing 5% or more changes in total import value
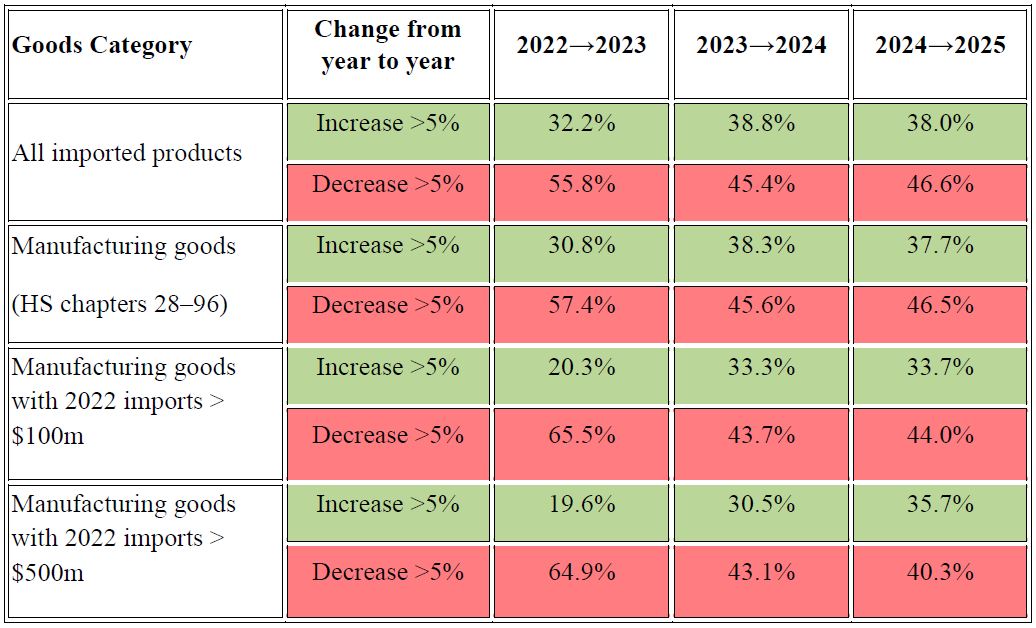
Once viewed in percentage terms, there appears to be no difference in the propensity of Chinese imports to fall in value between manufacturing goods and all goods. If anything, the propensity of non-manufactured goods to witness greater Chinese sourcing from abroad (rising to and above the 5% threshold) is higher than for manufactured goods.
When attention focuses on the bigger ticket manufactured import categories in 2022 (see the results in the last 4 rows of the table) then there is a sharp increase in the percentage of product lines where Chinese imports are growing. Simultaneously, there is a big fall between 2022-23 and 2023-24 in the percentage of big-ticket product categories recording a 5% decrease in imports.
Looking across the entire period 2022 to 2025, in separate calculations not reported in the tables above, there are 482 manufactured import categories where the total value of Chinese imports fell 5% every year. In contrast, there 182 manufactured goods where the total import value rose 5% each year. The total value of Chinese imports year-to-date fell $70 billion in the former category, a 55% drop from the import total recorded for 2022. For the latter category, the total value of year-to-date imports rose $83 billion, amounting to an 83% increase in the 2022 total import value.
Furthermore, we also explored whether there were cases of collapses in imports of big-ticket manufactured items, which one might expect if a policy of aggressive import substitution or foreign dependency reduction was being undertaken in recent years. We checked for products where total imports were $500m or more in year-to-date 2022 and had fallen to $100m of less in year-to-date 2025. This occurred exactly seven times (associated with HS codes 290723, 293712, 710399, 720110, 720711, 750400 and 854143). For balance, we checked if there were any cases where imports in 2022 were $100m or less that rose to $500m or more in 2025. Only two manufactured goods met that criterion (HS codes 700490 and 852419).
These facts further caution against making sweeping generalisations about Chinese import dynamics. There is evidence of extensive Chinese import retrenchment in recent years at the product level. However, rarely has such retrenchment lead to collapses of imports.
Table A1: Countries’ Overlap (in %) with Top Chinese Exports in 2015 and 2023