China's Exports in 2025: Bilateral Tariff Hit, Limited Global Diffusion
ZEITGEIST SERIES BRIEFING #85
ZEITGEIST SERIES BRIEFING #85
Simon Evenett
19 Feb 2026

The sharp escalation in United States import tariffs on Chinese goods during 2025 — reaching a peak rate of 145 per cent before settling, by official United States accounts, at an average of approximately 57 per cent — constitutes one of the most consequential unilateral interventions in global merchandise trade. Tariff barriers of this magnitude, applied to an economy with China's export scale, create in principle powerful incentives for trade redirection: Chinese exporters facing exclusion from the American market may seek to redirect their shipments towards third-country markets, thereby transmitting this tariff shock beyond the United States market.
It is precisely this transmission mechanism — and the question of whether it materialised in 2025 — that motivates the analysis which follows. Should the evidence point to a historically exceptional redirection of Chinese export flows, the implications extend beyond the immediate commercial interests of the countries concerned. Third-country import-competing industries confronted with a sudden increase in Chinese goods would face intensified competitive pressure, furnishing their respective governments with incentives to erect defensive trade barriers of their own. The 2025 episode thus presents an analytically tractable opportunity to assess whether the latest chapter of the United States–China trade tensions remained in one important respect a bilateral affair.
Much of the existing analysis of Chinese export redirection in 2025 — including work by me — has proceeded by comparing 2025 trade flows against a relatively recent baseline, typically the immediately preceding year. The purpose of this note, however, is to take a longer perspective, examining the evolution of Chinese export patterns since 2001, the year China acceded to the World Trade Organization. By benchmarking the 2025 data against both earlier episodes of global economic stress and a range of more proximate reference periods — including the years 2021 to 2024 — this analysis aims to assess whether 2025 represented a genuinely exceptional year for Chinese exports or whether the shifts observed fall within the bounds of variation that history might lead one to anticipate.
The empirical approach taken here — system-wide, grounded in the full post-WTO-accession record, and statistical — is designed to provide the kind of historical anchoring that shorter-run commentary is structurally unable to supply. For example, my approach facilitates comparison between the 2025 tariff fallout and the worldwide economic shocks associated with COVID-19 and the Global Financial Crisis.
This analysis draws on annual bilateral export value data sourced from Trade Data Monitor, using China Customs as the reporting authority, covering the period 2000 to 2025 inclusive. A full calendar year of Chinese merchandise goods export data for 2025 is now available. Trade flows measured in USD were used throughout this analysis.
After removing 13 non-sovereign and residual entities — such as Antarctica, unidentified destinations, and various regional aggregates — and applying a minimum-size threshold of USD 10 million in average annual exports since 2021, the dataset was further restricted to customs territories with complete observations across the entire sample period. This yields a balanced panel of 199 Chinese trading partners, collectively accounting for all but approximately 0.07 per cent of Chinese exports this century. European Union Member States are treated as individual customs territories throughout.
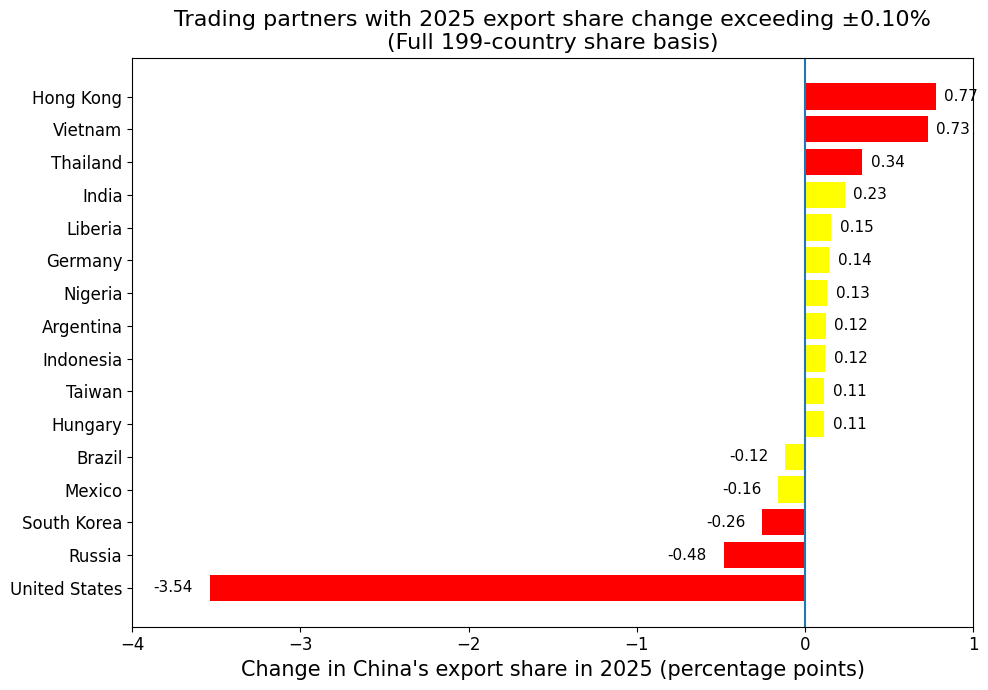
For each year, Chinese export shares were constructed as each destination's proportion of total recorded exports within the balanced panel. When compared to the Chinese export shares in 2024, Figure 1 shows that 16 customs territories saw their export shares rise or fall by more than 0.1%. Only six economies saw their export shares change by 0.25% or more (these jurisdictions are indicated in red in that Figure.)
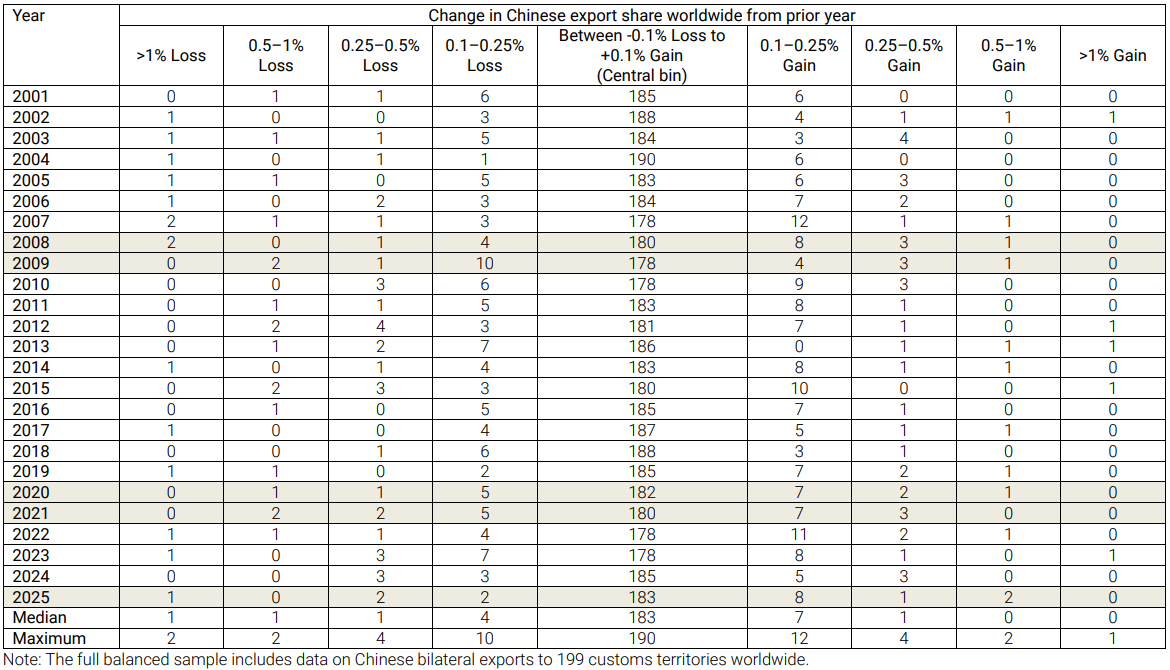
Next, year-on-year changes in these Chinese export shares were then assigned to one of nine bins, ranging from losses exceeding one percentage point to gains exceeding one percentage point, with a central bin capturing changes of no more than ±0.1 percentage points (see the Annex Table 1 for results). This central bin serves as the primary stability indicator: a high count of Chinese trading partners within it signals that the export-share distribution was largely undisturbed in that year. If 2025 saw unusual amounts of reshuffling of Chinese exports across destinations then it should be revealed in movements across the bins constructed.
Three summary statistics were computed for each year to characterise the distribution of share changes. The first is the count of destinations falling within the central bin, which measures the extent of redistribution — that is, how many destinations experienced meaningful shifts in their share of Chinese exports.
The second statistic is the cross-sectional variance of share changes across all destinations, which measures the range of redistribution. Because variance gives disproportionate weight to large individual movements, it is sensitive to a small number of destinations with outsized share changes even if the majority of the network is undisturbed.
The third summary statistic is the Shannon entropy of the nine-bin distribution, which measures the dispersion of outcomes across bins. Higher entropy scores indicate that destinations are spread more evenly across the full range of bins, whilst lower entropy indicates that most destinations cluster within a narrow range of outcomes, typically the central bin. Together, these three measures capture distinct dimensions of redistribution: breadth, range, and spread respectively, and their joint behaviour is more informative than any single statistic considered in isolation.
For each of the three statistics, the observed value for 2025 was compared against four baseline periods using a z-statistic. The z-statistic measures how many standard deviations the 2025 value lies from the mean of the baseline, with the baseline mean and standard deviation computed from the annual observations within that reference period.
A z-statistic that is large and positive would indicate that 2025 is an unusually high outcome relative to baseline; a large negative value indicates that 2025 is unusually low. The full analysis was conducted across four specifications: the complete 199-country panel with the United States included; the same panel with the United States excluded and shares recomputed across the remaining 198 destinations; and a restricted sample comprising the top 25 destinations by cumulative export value over 2021 to 2025, again with and without the United States.
The top 25 destinations together account for approximately 78 per cent of all Chinese merchandise exports in the panel. The inclusion and exclusion of the United States is a central diagnostic of the analysis, because any finding that survives US exclusion can be attributed to redistribution across third markets, whilst a finding that disappears upon US exclusion is indicative of a phenomenon concentrated in the bilateral US–China relationship. This distinction is fundamental to the central question the analysis seeks to answer.
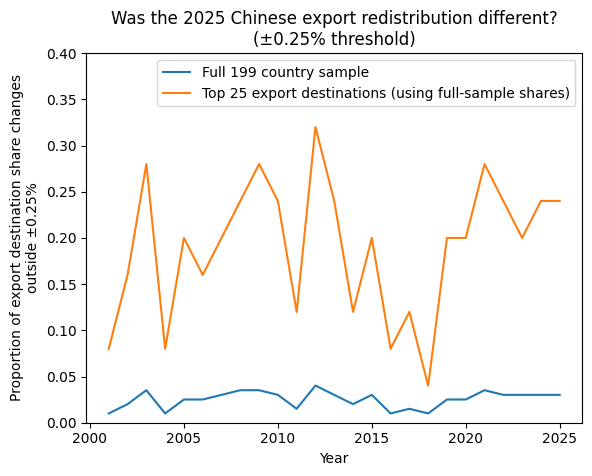
Before turning to the choice of appropriate benchmark for 2025 Chinese export data, Figure 2 plots the proportion of the full and top 25 samples each year where trading partners experienced changes in Chinese export share in excess of 25 basis points (both increases and reductions). For the full sample, the proportions are negligible—indicating how stable the Chinese export shares are for most of its trading partners. Reshuffling is limited and 2025 does not stand out in this respect either.
For the sample of top 25 Chinese export destinations, between a tenth and a quarter of these economies each year witness export shares that rise or fall by more than 25 basis points. The proportions recorded in Figure 2 for this sample are more volatile but there is no upward or downward trend since 2001, the year China joined the WTO.
Critically, when comparing the reported proportions for 2025 with earlier years, in neither sample are the proportions recorded for 2025 outliers. This casts doubt on claims that higher U.S. import tariffs have immediately induced a global shift in Chinese exports. In what follows, the outcome of formal statistical tests of whether 2025 Chinese export changes were exceptional are described.
The selection of baselines is not merely a technical matter; it is an analytical choice that determines the intertemporal questions one is capable of answering. Each of the four baselines employed here asks a distinct question about the nature and severity of the 2025 episode, and the four together support a richer assessment than any single comparator could achieve. This is precisely the value of the longer-run perspective adopted in this note: by making comparisons to different baselines, it becomes possible to situate 2025 within a far more informative context than short-run comparisons permit.
The first and most directly policy-relevant baseline is the recent period of 2021 to 2024. This four-year window captures the post-pandemic recovery and the continuation of elevated geopolitical trade tensions that preceded the 2025 tariff escalation. If 2025 is statistically unusual relative to this baseline, there is credible evidence of a discrete break; if it is not, the shifts observed are better characterised as a continuation of already-prevailing dynamics. Estimated from four annual observations, this baseline is both statistically tractable and temporally proximate, making it the most causally informative of the four comparators for the specific question at hand.
The second baseline is the full historical period from 2001 to 2024, encompassing the entirety of China's post-WTO-accession export track record. This baseline asks not merely whether 2025 was unusual relative to recent years, but whether it was unusual by the standards of the full quarter-century record — a period that includes China's extraordinary initial export expansion, the disruptions of the Global Financial Crisis, the subsequent recovery, the first phase of US–China trade tensions after 2018, and the COVID-19 shock. Estimated from 24 annual observations, this is the most statistically robust of the four baselines. A finding of significance against it constitutes the strongest available claim that 2025 was genuinely atypical; a finding of insignificance is correspondingly powerful evidence against abnormality during 2025.
The third baseline is the Global Financial Crisis (GFC) of 2008 to 2009. Its inclusion serves a specific analytical purpose: the GFC was a severe and synchronised global demand shock that affected virtually all trading economies simultaneously, compressing trade volumes worldwide and producing potentially sharp changes in bilateral trade shares as the composition of global demand shifted abruptly.
Benchmarking 2025 against the GFC therefore asks whether the tariff-driven shifts of 2025 were comparable in breadth and intensity to that episode of global trade disruption. A finding that 2025 is statistically more stable than the GFC years is highly informative, suggesting that the tariff shock — whatever its bilateral severity — did not produce the kind of system-wide disruption that a synchronised global demand collapse generates.
The fourth baseline is the COVID-19 shock period of 2020 to 2021, chosen because it is the more recent case of severe global disruption. The pandemic produced extraordinary disruptions to global supply chains, demand patterns, and shipping capacity. Comparing 2025 against the COVID years therefore asks whether the 2025 tariff escalation produced redistribution of an intensity comparable to a once-in-a-generation supply-and-demand pandemic-related shock.
It should be noted, as a technical matter, that baselines estimated from only two years — as in the GFC and COVID cases — yield z-statistics based on a potentially small denominator, which can produce mechanically large values. The directional interpretation of these results is nonetheless informative even where precise magnitudes should be treated with appropriate caution. This caveat applies with particular force to the variance test statistics (outlined below).
Taken together, the four baselines provide three analytically distinct types of comparison. The recent and full-history baselines establish whether 2025 was normal or exceptional by the standards of the prevailing and long-run historical regimes. The GFC and COVID baselines ask whether 2025 generated Chinese export reshuffling witnessed during prior systemic crises. The interplay between these comparisons is itself informative: a year that is unusual relative to the recent past but normal when compared to a longer sweep of time may, for example, reflect regime drift rather than a discrete shock.
The bin distribution in 2025
Before turning to the formal statistical tests, it is instructive to examine the raw bin data. In a typical year across the full sample period, the large majority of the 199 panel destinations fall within the central bin, recording export-share changes of no more than ±0.1 percentage points. The median count of destinations in the central bin across 2001 to 2025 is 183, and the maximum observed across the entire sample period is 190, reached in 2004 (see the Annex Table). In 2025, exactly 183 destinations fell within the central bin — precisely the long-run median.
No bin involving larger export share changes contains more than two export destinations in 2025, a figure entirely consistent with the historical record. Only 2008, the start of the GFC, saw three Chinese export destinations experience share shifts in excess of 0.5% (see Figure 1). This initial inspection casts doubt on 2025 standing out in terms of reshuffling Chinese exports across foreign economies.
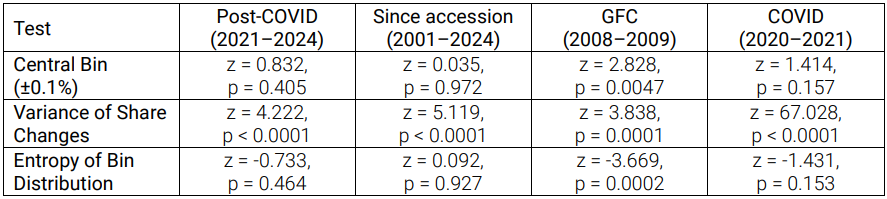
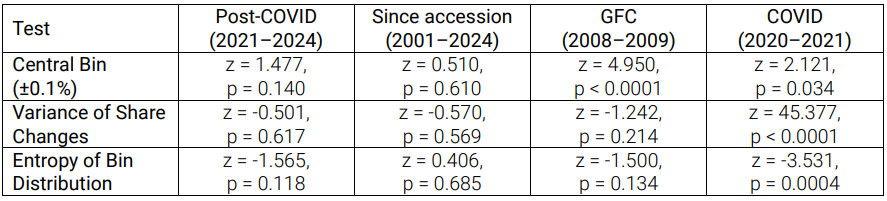
Turning to the formal z-statistics for the full 199-country panel with the United States included, a differentiated pattern emerges across the three measures. The z-statistics for the central-bin count are small and statistically insignificant against the two causally important baselines: against the recent period of 2021 to 2024, z = 0.832 (p = 0.405), and against the full history of 2001 to 2024, z = 0.035 (p = 0.972). These results indicate that the number of destinations experiencing negligible share changes during 2025 was not out of line with the norm. The entropy measure corroborates this finding: z = −0.733 (p = 0.464) against the recent baseline and z = 0.092 (p = 0.927) against the full history, indicating that the spread of destinations across bins was equally unremarkable.
Against the GFC baseline, the central-bin z-statistic rises to 2.828 (p = 0.005) and the entropy z-statistic falls to −3.669 (p = 0.0002). Crucially, the signs of these test statistics indicate that 2025 was more stable than the GFC years rather than more redistributive.
The comparison with the COVID baseline similarly yields insignificant results for the central-bin and entropy measures, reinforcing the conclusion that 2025 was not crisis-like in its breadth of redistribution even when the United States is included in the sample.
The test statistics based upon variance of share changes present a different picture. Against the recent baseline, the z-statistic for variance is 4.222 (p < 0.0001), and against the full historical baseline it is 5.119 (p < 0.0001). Against the GFC and COVID comparators, the variance z-statistics are similarly large and significant. These results indicate that, while the number of destinations experiencing share movements was normal, the magnitude of those movements — as captured by their squared deviations — was anomalously large in 2025 across all four baselines. This is the outcome of a small number of destinations recording unusually large share changes while the bulk of the Chinese export network remained little changed.
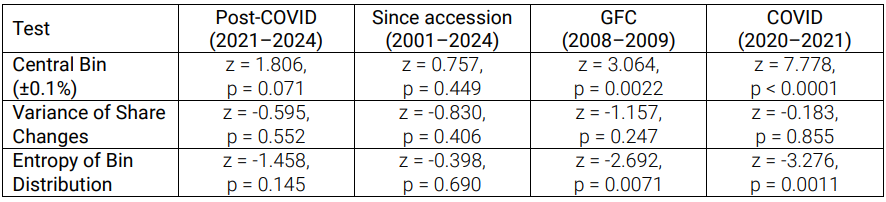
The diagnostic power of excluding the United States—the proximate source of last year’s tariff shock—is apparent. Once the United States is removed from the sample and shares are recomputed across the remaining 198 destinations, the variance result mentioned in the last paragraph disappears entirely. Against the recent baseline, the z-statistic for variance falls to −0.595 (p = 0.552), and against the full history it is −0.830 (p = 0.406) — both statistically insignificant.
Indeed, negative signs of these test statistics imply that the distribution of share changes among non-US export destinations was, if anything, marginally more compressed in 2025 than in earlier periods. Similar findings arise with the GFC baseline, z = −1.157 (p = 0.247), and the COVID baseline, z = −0.183 (p = 0.855). The variance result therefore disappears not merely against the recent and full-history baselines, but against the crisis baselines as well.
This is a decisive finding, establishing that the anomalous variance observed in the full-panel results is attributable almost entirely to the movement in the United States' share of Chinese exports, and not to any generalised redistribution across the remainder of the network of Chinese export destinations.
The central-bin and entropy z-statistics in the US-excluded specification remain insignificant against the recent and full-history baselines. The only significant results in this specification arise in comparisons against the GFC and COVID baselines, where 2025 again appears more stable than those crisis years: the central-bin z-statistic against the GFC is 3.064 (p = 0.002) and against the COVID baseline is 7.778 (p < 0.0001), both indicating greater central-bin concentration in 2025 rather than dispersal. This reinforces the conclusion that the export-share redistribution among non-US destinations in 2025 was not abnormal and, if anything, was possibly less far-reaching.
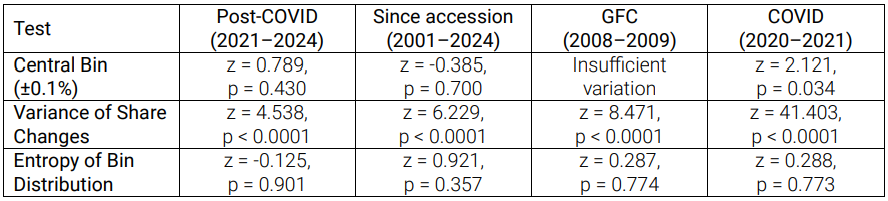
Restricting the analysis to the top 25 Chinese export destinations does not materially alter the conclusions, but adds a useful further dimension. With the United States included, the variance z-statistic is 4.538 (p < 0.0001) against the recent baseline (2021-2024) and 6.229 (p < 0.0001) against the full history (2001-2024). The values of these test statistics are larger than in the full-panel specification, indicating that the intensity signal is concentrated within the major-destination subsample rather than being diffused across smaller markets.
The central-bin and entropy measures again show no unusual behaviour in 2025 against the recent and full-history baselines, with z-statistics that are small and insignificant. This reinforces the finding that any variance spike is associated with a major partner rather than with substantial reshuffling of exports across other Chinese export destinations.
Once the United States is excluded from the top 25 sample, the variance test statistic again becomes unremarkable: z = −0.501 (p = 0.617) against the recent baseline and z = −0.570 (p = 0.569) against the full history. The central-bin and entropy results are similarly insignificant against these two baselines.
An apparently large variance z-statistic against the COVID baseline (z = 45.377, p < 0.0001) merits particular caution: as noted in the methodology section of this note, this magnitude is best understood as an artefact of the two-year estimation window producing a very small standard deviation, rather than as meaningful evidence that 2025 was more redistributive than the COVID period among major non-US destinations. The results against the recent and full-history baselines, estimated from four and twenty-four years of observations respectively, provide the appropriate guide, and both indicate normality.
Across the 48 z-statistics computed and reported here — spanning four specifications, three distributional measures, and four baselines — the weight of evidence supports an over-arching finding. Of those 48 tests, 19 reach conventional significance thresholds at the five per cent level. However, the directional character and origin of those significant results are at least as informative as their number. When the United States is included in the sample, significant results cluster overwhelmingly in the variance measure across all four baselines; breadth and dispersion measures are almost uniformly insignificant against the causally relevant recent and full-history baselines. When the United States is excluded, the variance significance disappears across all meaningful baselines in both the full-panel and top-25 specifications.
The remaining significant results, once the United States is excluded, are confined to comparisons against crisis-era baselines and uniformly indicate greater stability in 2025 than in those reference years — not greater export reshuffling. Against the recent baseline, 2025 shows no unusual breadth or dispersion of redistribution. Against the full-history baseline, the same conclusion holds. Against the GFC and COVID baselines, 2025 appears more orderly, not less, among non-US destinations. The 2025 tariff shock therefore sits below the threshold of systemic disruption represented by those two episodes in terms of its effects on the global destination network of Chinese exports, even as it produced significant export retrenchment to the United States in 2025.
The most defensible reading of the full body of test statistics presented here is, therefore, that 2025 was characterised by concentrated bilateral adjustment centred on the United States rather than by a diffuse, system-wide redirection of Chinese exports; that the tariff-driven reduction of the US share of Chinese exports did not translate into jumps in shares experienced in many other third markets.
The limited redirection of Chinese exports observed in 2025 invites a deeper question: under what circumstances might Chinese exporters be unwilling or unable to redirect exports rapidly? Several structural factors could bear on the speed of adjustment. On the demand side, the goods China sold to the United States — consumer electronics, machinery, furniture, apparel — may not match the demand profile of plausible alternative destinations, many of which are lower-income economies seeking different product varieties and price points.
On the supply side, factories configured for the American market have often invested in US-specific standards, certification, and retailer specifications, making rapid redeployment costly. Long-term contracts, established distribution networks, and the sunk costs of market entry create further inertia. Where Chinese exports consist of intermediate goods embedded in American-led value chains, the chain itself is disrupted rather than redirected, with no obvious alternative assembler ready to absorb displaced inputs.
Exchange rate movements accompanying the tariff escalation may have partially offset the price incentives for redirection in third markets, whilst exporters anticipating a negotiated resolution to the tariff dispute may have preferred to absorb short-run losses rather than invest in costly market diversification. The absorptive capacity of alternative destinations might also matter: port infrastructure, distribution logistics, and wholesale networks in many potential recipient markets constrain how quickly import volumes can be scaled up regardless of price signals.
The remarkable stability of Chinese export share distributions since 2001 — with the central bin count fluctuating narrowly around a median of 183 destinations throughout — suggests that these frictions are not peculiar to 2025 but reflect durable features of how Chinese export production is organised and how trade relationships form and persist over time.
This analysis set out to test, within a long-run frame stretching back to China's accession to the World Trade Organization in 2001, the proposition that the sharp escalation of United States tariffs on Chinese goods in 2025 produced a historically unusual redistribution that year of Chinese export shares across global destinations.
The statistical findings presented here do not broadly support that proposition. While the variance of year-on-year share changes is anomalously large in 2025 relative to both recent and long-run historical norms when the United States is included in the analysis, this result is attributable almost entirely to Chinese export reductions to the United States. Excluding the United States, no distributional measure indicates that the Chinese export reshuffling of 2025 was statistically different from that witnessed during the recovery from the COVID-19 pandemic and from years following China’s WTO accession.
The 2025 distribution of Chinese export changes, with 183 of 199 trading partners witnessing less than 0.1 percentage points change in export shares, sits precisely at the long-run median for the entire period since 2001. This is a finding that only a long-run analysis can establish with confidence, and it provides historical context that shorter comparison periods cannot provide.
By ranging across four carefully chosen baselines, this note is able to advance claims that are not available to shorter-run work. For example, the evidence presented here implies that the non-US destination network for Chinese exports experienced less change in 2025 than during either the Global Financial Crisis of 2008 to 2009 or the COVID-19 shock of 2020 to 2021 — two episodes widely understood to have been among the most severe disruptions to global trade in living memory.
This ranking carries direct and immediate policy relevance. The fear motivating much of the commentary on Chinese export redirection in 2025 is that displaced Chinese goods would flood third markets, intensifying competitive pressures on import-competing industries worldwide and triggering a second-order wave of protectionism beyond the United States. The evidence presented here suggests that this scenario did not materialise to a historically significant degree during 2025. Third markets absorbed no more disruption from shifts in Chinese export shares than they typically do in a normal year — and considerably less than they absorbed during the GFC or the COVID-19 pandemic.
It is worth emphasising what this comparison implies. Neither the GFC nor the COVID-19 shock produced the cascade of retaliatory global protectionism that the redirection hypothesis implies should follow broad export displacement. If those far more systemically disruptive episodes did not trigger a cascade of protectionism, the case for anticipating one from the more contained redistribution observed in 2025 is correspondingly weaker.
Measured in USD terms, the fall in Chinese exports to the United States last year was large. Its diffusion into the broader global trading system was, however, limited — at least during the year under review. Whether that remains the case as the tariff regime persists and exporters adapt over a longer horizon is a question that only future data will resolve. However, the findings based on statistical analysis of 2025 Chinese export dynamics do not support the more alarmist assessments that have been offered and weaken the case for emulating the U.S. turn inward on trade.
If the structural factors identified in the last section as drivers of the pace of Chinese export redirection are indeed operative, they carry another important implication: the limited redirection observed in 2025 is not merely a short-run phenomenon that will resolve itself as exporters adapt: it might reflect durable features of how Chinese export production is organised, how global demand is structured, and how trade relationships form and persist. This would suggest that the fears driving calls for third-country protective measures against anticipated surges of redirected Chinese goods may be premised on an overly fluid model of trade in which goods move frictionlessly between destinations in response to price signals. The real world of trade is likely to be stickier, more relationship-dependent, and more constrained by infrastructure and value-chain configuration than that mental model implies.
Simon J. Evenett is Founder of the St. Gallen Endowment for Prosperity Through Trade, Professor of Geopolitics and Strategy at IMD Business School, Lausanne, Switzerland and Co-Chair of the World Economic Forum’s Trade & Investment Council. Comments can be sent to him at simon.evenett@sgept.org