U.S. Reciprocal Tariffs & Trading Partner Cost Competitiveness
ZEITGEIST SERIES BRIEFING #61
ZEITGEIST SERIES BRIEFING #61
Simon Evenett
07 Apr 2025

On 2 April 2025, the United States announced tariff increases on goods imports. Barring a few exceptions, the tariff increases faced by America’s trading partners vary from a minimum of 10% to a maximum of 50%. Those tariff rates were determined using a formula based on bilateral trade deficits and, critically, not on trading partner policy stance or other pertinent characteristic, such unit labour costs.
Competitiveness—a broad concept encompassing many factors—is relative. While almost all America’s trading partners are likely to be hit with higher tariffs, current plans suggest some will be hit harder than others. Therefore, it is important to differentiate between absolute and relative impact. This ought to be of interest to the many governments that pay close attention to national competitiveness rankings.
The observations above raise the question whether rankings of nations based on factors known to drive location decisions are markedly affected by the new tariffs. This briefing explores this matter, at least as it relates to measures of wage and energy costs and the outlays necessary to build a new factory or commercial facility. Therefore, consider this briefing as exploring the impact of U.S. reciprocal tariffs on trading partner cost competitiveness.
A word of caution is appropriate at this stage. No reader should be under any illusion that there is comprehensive, high-quality data that can be readily downloaded on the many drivers of corporate location decisions. Although I shall indicate the three sources I used, some readers may have alternative, preferred data sources—in which case, they may want to re-run the analysis conducted here. In addition, the approach I take is deterministic—more sophisticated variants could try to control for measurement errors.
In essence, my approach is to obtain a large cross-section of up-to-date data on a particular driver of location decisions, such as hourly wage rates. I will rank America’s trading partners on that driver from lowest to highest. Then, I will multiply each driver by its nation’s respective reciprocal tariff rate, re-rank them, and identify which countries’ ranking change a lot within their own region and globally.
Notice it is the ranking of the product of the location driver and (one plus) the reciprocal tariff rate that matters here, not simply the ranking of the reciprocal tariff rates announced last week. A low wage economy may be hit with a high reciprocal tariff but, because it operates in high wage region, it may still remain near the bottom of a regional labour cost ranking.
My focus is on three oft-mentioned cost drivers of location and sourcing decisions: wages, energy, and construction. Although the Asia-Pacific, Central Asia, and Europe feature prominently in the charts prepared for this Briefing, data for other economies is available upon request.
Ideally, a comparison of unit labour costs in the same line of business (say, manufacturing) would be preferable to one based on wage costs alone—for the former also takes account of productivity differences. But cross-country unit labour comparisons outside of the OECD are hard to come by. Moreover, less information on manufacturing hourly wage costs is available than for hourly minimum wage data. The latter is available for 144 of America’s trading partners. Arguably, minimum wages act as a floor on all wages in the formal economy (which is presumably of interest to international business and to governments.)
Data on 2025 hourly minimum wage rates expressed in U.S. dollars was collected and ranked. Then each country’s reciprocal tariff was added, the countries ranked again, and differences in ranking between the tariff-free and tariff-ridden cases examined. While the Spearman Rank Correlation Coefficient between the two rankings was a very high 0.993, there are meaningful shifts in the rankings of certain economies (where rank 1 is the lowest wage cost nation and higher ranks indicate higher wages.)
Figures 1 and 2 report the changes in worldwide ranking of countries located in the Asia-Pacific and the European and Central Asian regions, respectively. Hit by high reciprocal tariffs, Thailand and Vietnam fall 10 places in the wage cost ranking. Meanwhile, China and Laos fall five places. Timor-Leste gains in wage competitiveness. These findings imply increased incentive to shift sourcing and production away from China and ASEAN to other parts of the world. China+1 strategies need reassessment, especially if the +1 involved certain hard-hit ASEAN nations.
As far as wage cost competitiveness changes are concerned, Europe separates into three groups of nations: hard-hit Balkan nations (such as Bosnia and Herzegovina, and Serbia), a largely unaffected European “core,” and then a group witnessing relative wage cost improvements that includes the UK, Russia, and several Central Asian nations. Overall, the periphery of Europe’s economy sees its competitiveness improve with respect to the core, with implications for further deindustrialisation of that core.
In recent years, cross-country differences in energy costs have been thought to be an important driver of manufacturing sector competitiveness. I obtained 2024 data on energy cost per kilowatts in U.S. dollars for 141 American trading partners. Again, I ranked these economies with the tariff-free and with tariff-adjusted energy costs per kilowatt. The rankings were compared and variation within and between regions explored. Figures 3 and 4 present key findings.
The reshuffling in energy cost competitiveness within the Asia-Pacific region (Figure 3) is greater than in the European and Central Asian regions (Figure 4), as seen by comparing the scales of the horizontal axes. If these reciprocal tariffs come to pass, then economies near both regions’ centres of economic gravity will lose ground.
Wage and energy costs typically relate to recurring operational costs. Upfront construction costs for new commercial facilities are an important part of the investment case as well. An International Construction Cost Index for 2024 covering 100 cities was around the world was used to identify the lowest cost city location within 52 economies that trade with the United States. The lowest cost city location was taken as the benchmark for the country in question. Again, smaller construction costs were represented by a lower rank. The steps taken earlier were repeated.
When compared to Figures 1-4, Figures 5 and 6 reveal less reshuffling of construction cost rankings on account of the reciprocal tariffs (the cumulative distribution curves in Figures 5 and 6 are much steeper than before and centred around zero changes in ranking). Still, certain periphery countries in each region gain in competitiveness—Australia and Singapore in the Asia-Pacific region and Turkey and the UK in Europe. In contrast, Thailand, Vietnam, Bosnia and Herzegovina, and Serbia fall back when compared to regional peers.
It remains to be seen if the U.S. reciprocal tariffs stick, whether they are subsequently reduced through negotiation or increased due to tariff retaliation and escalation. If the announced rates do stick, then the evidence presented here implies that national cost competitiveness will shift in ways likely to affect foreign direct investment decisions, sourcing decisions, and assessments of the commercial footprint of international business.
Such findings may spur governments of seriously disadvantaged economies to seek an accommodation with the Trump Administration that results in lower reciprocal tariffs. Or the governments in question may offer more inducements to international business or, preferably, to take steps to improve their business environments. Ultimately, the benefits of supply-side reform may be a silver lining to the trade policy chaos currently under way.
Simon J. Evenett is Founder of the St. Gallen Endowment for Prosperity Through Trade, Professor of Geopolitics & Strategy at IMD Business School, and Co-Chair of the World Economic Forum’s Trade & Investment Council.
Figure 1: Reciprocal tariffs hit Asian wage competitiveness when benchmarked to other regions.

Figure 2: Wage competitiveness rankings shift for those nations away from Europe’s “core”.

Note: In both charts countries are ranked from lowest to highest minimum wages. So a fall in ranking for a nation means the reciprocal tariffs have made their minimum wages more expensive compared to rivals.
Figure 3: Energy-intensive firms may need to revisit assumptions about low cost sites within the Asia-Pacific.

Figure 4: Energy cost rankings reshuffle less within Western Europe and Central Asia than in the Asia-Pacific.

Note: In both charts countries are ranked from lowest to highest energy costs. So a fall in ranking for a nation means the reciprocal tariffs have made their energy costs more expensive compared to rivals.
Figure 5: In the Asia-Pacific a few nations see marked shifts in the cost of factory building.
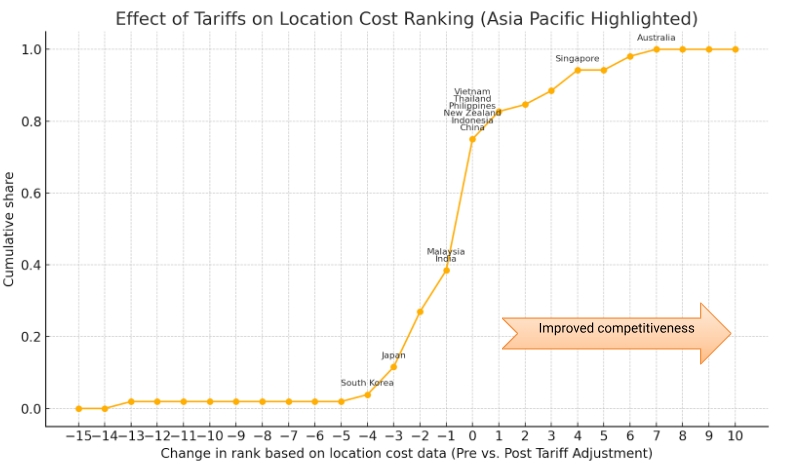
Figure 6: Within Europe, the UK’s attractiveness as a place to build new facilities improves markedly.

Note: In both charts countries are ranked from lowest to highest value of a location construction cost index. So a fall in ranking for a nation means the reciprocal tariffs have made their location more expensive to build in compared to rivals.